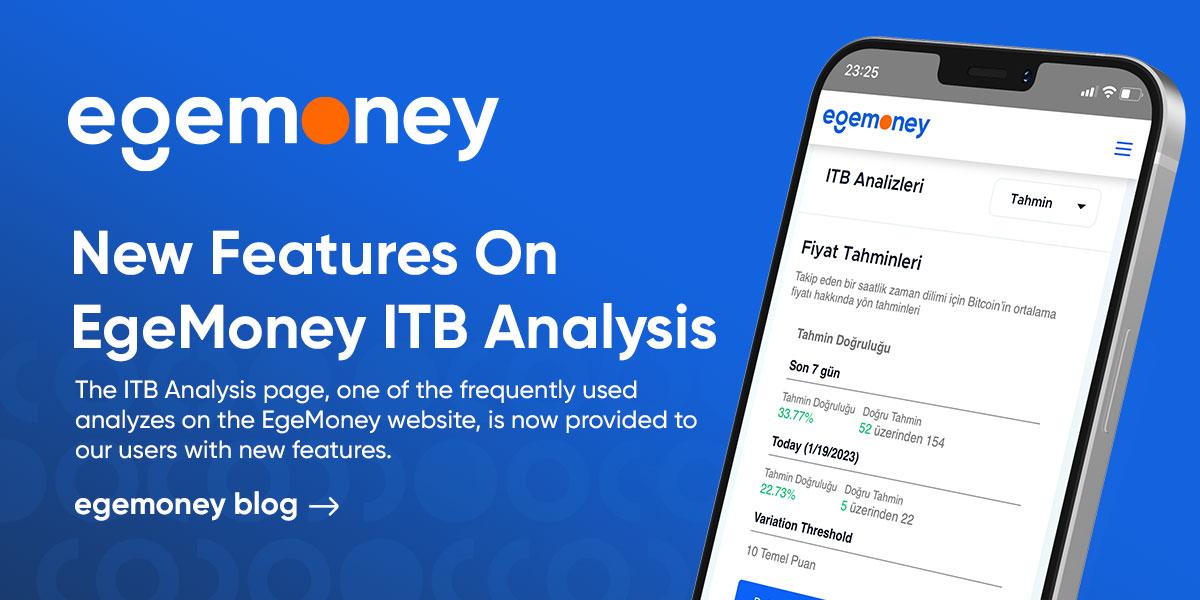
The ITB Analysis page, one of the frequently used analyzes on the EgeMoney website, is now provided to our users with new features.
What is ITB Analytics?
EgeMoney ITB Predictions is an analysis method of Ege Money users that offers directional price predictions and different types of analysis of crypto coins on the ITB Platform. Users can access these analyzes without logging into the website.
ITB is a platform that produces crypto prediction models using technological innovations brought by AI. The platform has over 50 TB of crypto prediction data. In addition, new data continues to be developed. ITB is a completely transparent platform.
How can I access ITB Analytics?
Firstly, click on the “ITB Analysis” option under the “Analysis” heading from the menu at the top of the website.
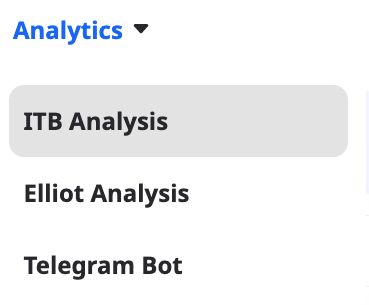
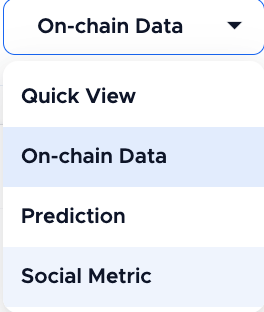
The page that comes up shows you an overview of the analysis. You can change the tab you are in from the top right. Each tab offers different analytics. Currently, the tabs are as follows:
- Quick View
- On-chain Data
- Prediction
- Social Metric
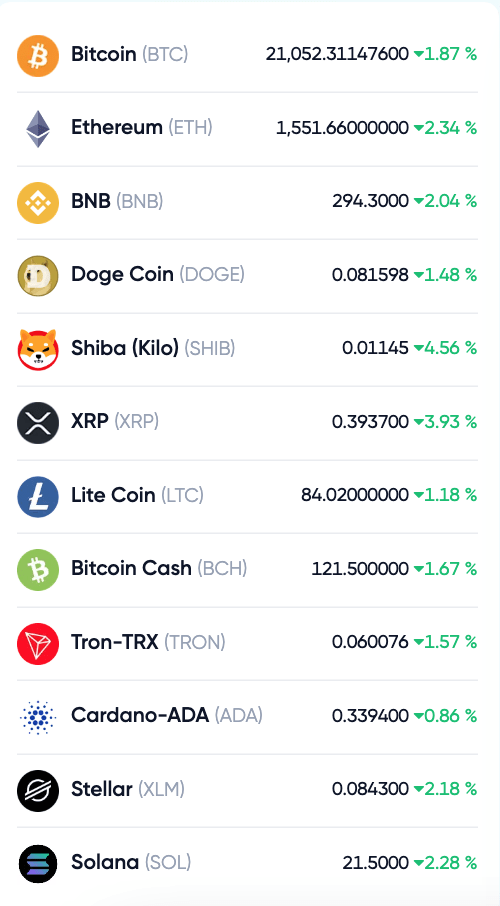
You can examine it by selecting any of the coins on the left.
New ITB Analysis features
As a result of new updates to EgeMoney ITB Predictions, different tabs have been added: On-chain data and social metrics. You can access these two new tabs by clicking on the options at the top right of the page.
On-chain data: On this page, you can see the number of large transactions, average transaction fees, daily active addresses, and address concentrations.
Large trading volumes refer to the number of more than $100,000 per day. Daily active addresses are the number of addresses that trade on that day. Address concentrations examine addresses grouped by the percentage of their circulating supply.
You can review all these features by scrolling down the page. Additionally, you can see the analysis of the coin you want by selecting.
Social media metrics: In this tab, you can view GitHub and Trends Search. Green lines in the Github graph indicate support for the project. Dark blue lines allow users to make changes to the project without affecting the original. Orange lines indicate open issues.
Search trends are trends in Google searches over the past 90 days or 1 year. Google shows this graph relative to that keyword with a maximum score of 100 on the most searched day on Google.
You can also view different analysis methods on the EgeMoney website. Don’t forget to follow EgeMoney blog for more.
Merhaba! İçerik ekibimiz, çeşitli uzmanlık alanlarına sahip deneyimli yazarlardan oluşmaktadır. Bizi takip ederek en güncel bilgilere ulaşın.