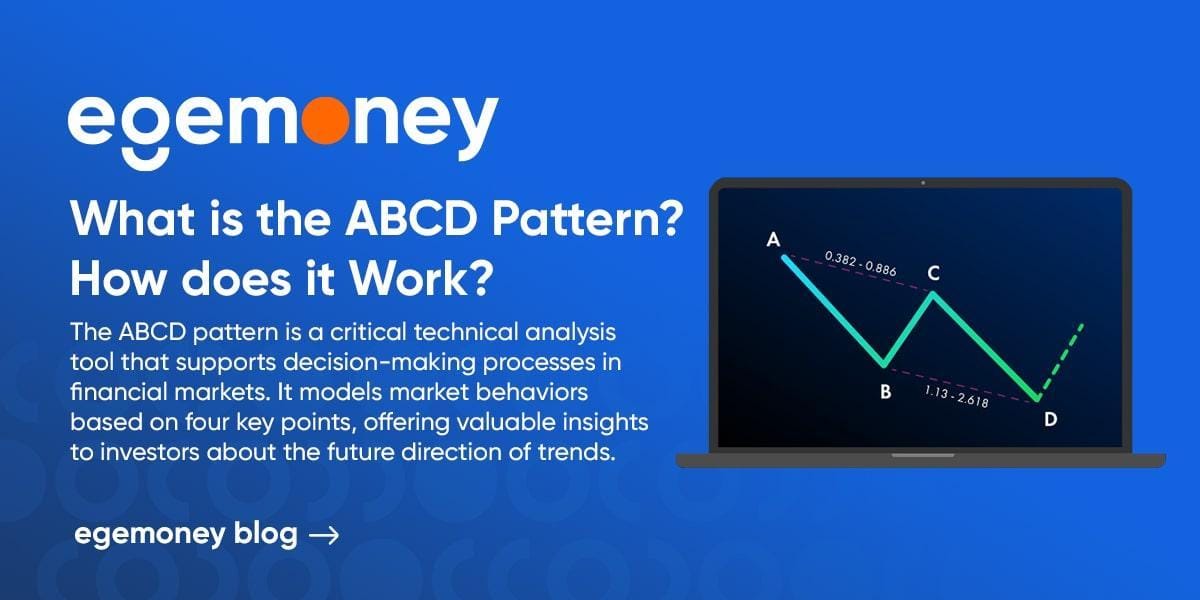
The ABCD pattern is a critical technical analysis tool that supports decision-making processes in financial markets. It models market behaviors based on four key points, offering valuable insights to investors about the future direction of trends. This article will thoroughly explore the fundamentals of the ABCD pattern, how it operates, the variations encountered in practice, and how it can be integrated into investment strategies.
What is the ABCD Pattern?
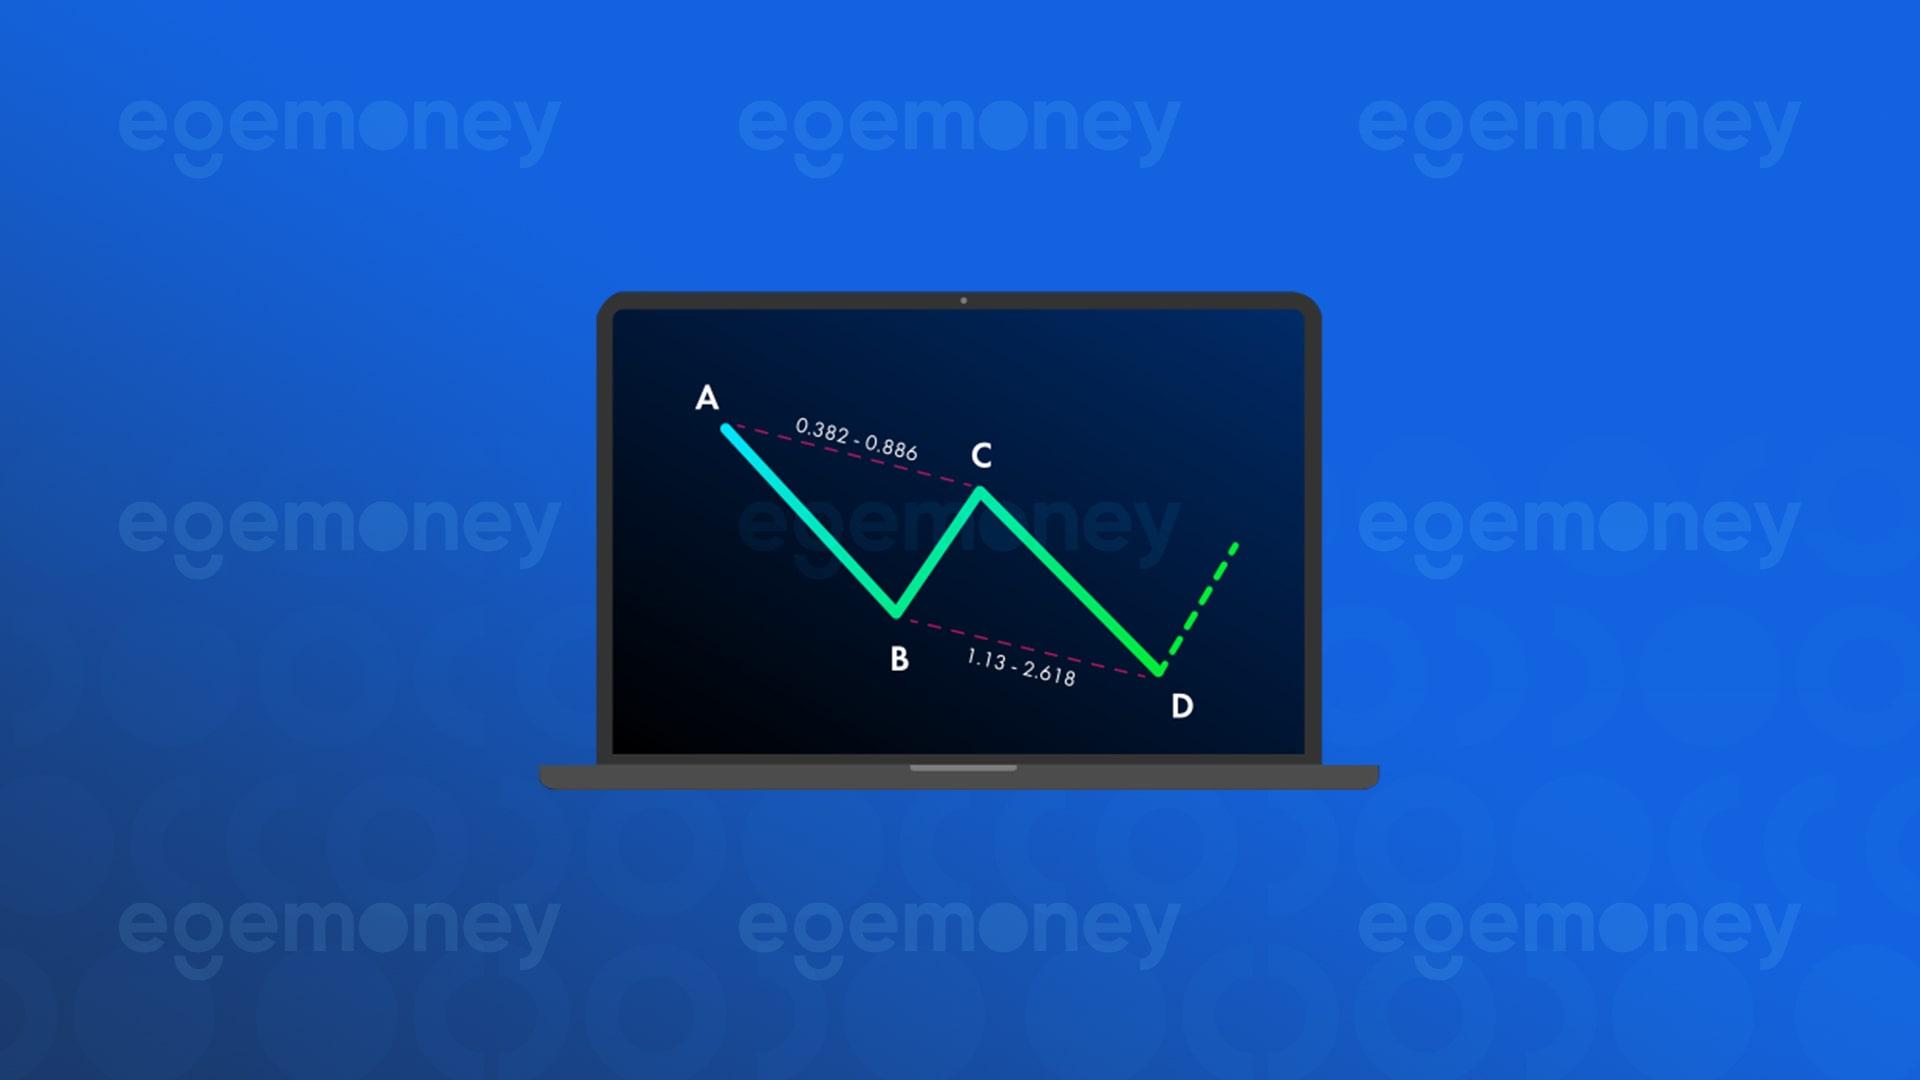
The ABCD pattern is one of the technical analysis models used to predict price movements in financial markets. Fundamentally, it assumes that the price movement of an asset follows a specific pattern. This formation consists of four points (A, B, C, and D) and is generally interpreted as a signal that the trend will continue. The movement from point A to B shows the market’s initial tendency. The corrective movement from point B to C indicates that this trend has temporarily reversed. Finally, the movement from point C to D predicts that the initial trend has regained strength and will continue.
How Does the ABCD Pattern Work?
The ABCD pattern follows a specific structure whether the market is in an uptrend or downtrend. The initial movement between points A and B represents the beginning of the trend. After point B, the price pulls back towards point C. Finally, after point C, the price rises or falls again until it reaches point D. Point D marks the completion of the formation and the point where the price’s next movement can begin. There are two main types of the ABCD pattern: bullish and bearish.
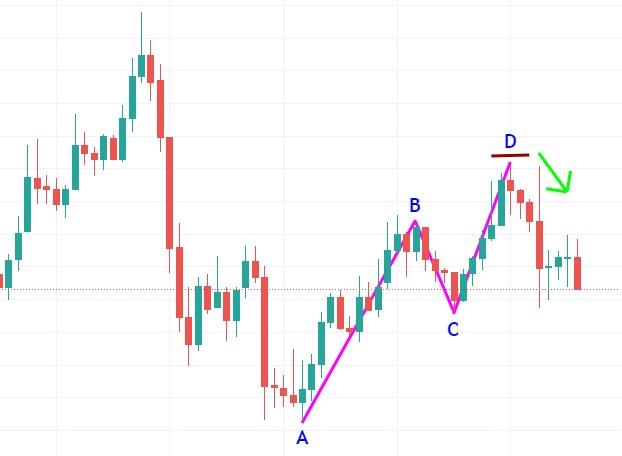
The bullish ABCD pattern is characterized by prices reaching a high point (B) before experiencing a drop (C) and then surpassing the previous peak to reach a higher point (D). This pattern indicates buying opportunities and usually signals that the uptrend will continue.
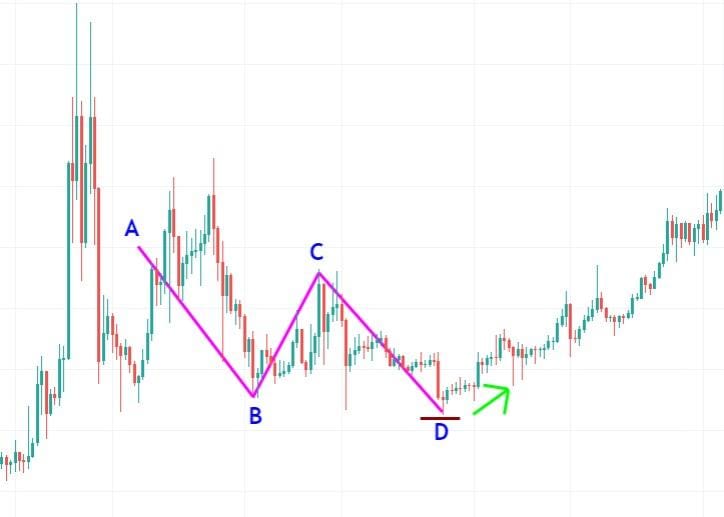
The bearish ABCD pattern is characterized by prices dropping to a low point (B) before experiencing a rise (C) and then falling below the previous low to reach a lower point (D). This pattern indicates selling opportunities and usually signals that the downtrend will continue.
Technical Features of the ABCD Pattern
To effectively utilize the ABCD pattern, investors are advised to confirm its strengths with additional technical analysis tools such as Fibonacci retracement levels. The C point is often found at the 61.8% or 78.6% Fibonacci retracement level of the movement between A and B. The D point typically occurs at the 127.2% or 161.8% Fibonacci extension level of the movement between B and C. Successfully recognizing and applying the ABCD pattern can provide investors with significant advantages in determining the appropriate timings for buying or selling in the market.
You may be interested: “What is the Diamond Chart Pattern? How to Trade?“
Use of the ABCD Pattern in Investment Strategies
Investors and traders use the ABCD pattern to determine market entry and exit points. The D point of the formation is often considered a potential buying signal, while the C point is seen as a possible correction and buying opportunity. Correctly identifying and interpreting the ABCD pattern can offer investors an edge in the market. However, using this pattern in conjunction with other technical analysis tools and indicators can yield more effective results. This approach ensures that investment decisions are based on a more solid foundation and enhances the accuracy of market analysis.
The Psychological Aspect of the ABCD Pattern
Market psychology plays a significant role in the effectiveness of the ABCD pattern. Since this formation reflects the behavioral patterns of market participants, it helps investors and traders understand market sentiment. The strong movement from point A to B indicates optimism in the market; the decline from B to C represents profit-taking or temporary apprehension. The commencement of the movement from C to D signals that confidence in the initial trend has been restored and that the trend is likely to continue. These psychological aspects allow investors to gain a deeper understanding of market movements and develop strategies accordingly.
The information presented in this article is for general informational purposes and does not constitute any investment advice. Readers are advised to conduct their own research and consult a professional financial advisor before making financial decisions.