
What are Fibonacci Retracement Levels?
Fibonacci retracement levels are a tool used in technical analysis to identify potential support and resistance levels in market price movements. These retracement levels are particularly essential in financial markets and are one of the fundamental tools used by investors and traders to analyze price movements. The Fibonacci retracement levels are based on a number sequence discovered by an Italian mathematician named Leonardo Pisano Fibonacci.
How Do Fibonacci Retracement Levels Work?
Fibonacci retracement levels are used to predict when a certain percentage of a financial asset’s price movement will pull back. These levels are typically set at 23.6%, 38.2%, 50%, 61.8%, and 100%. These ratios indicate potential levels where a portion of an asset’s price rise or fall may retract.
Investors and traders use these levels, especially after a significant price movement, to understand how much the market might retract and at which levels it might encounter support or resistance. For example, after a substantial increase in an asset’s price, traders can use these Fibonacci levels to predict the levels the price might reach before starting to decline.
Fibonacci retracement levels are drawn on a price chart using horizontal lines. These lines are placed at different points on the price chart according to the determined percentage ratios. These levels can be used by investors and traders as potential entry or exit points for their trading decisions.
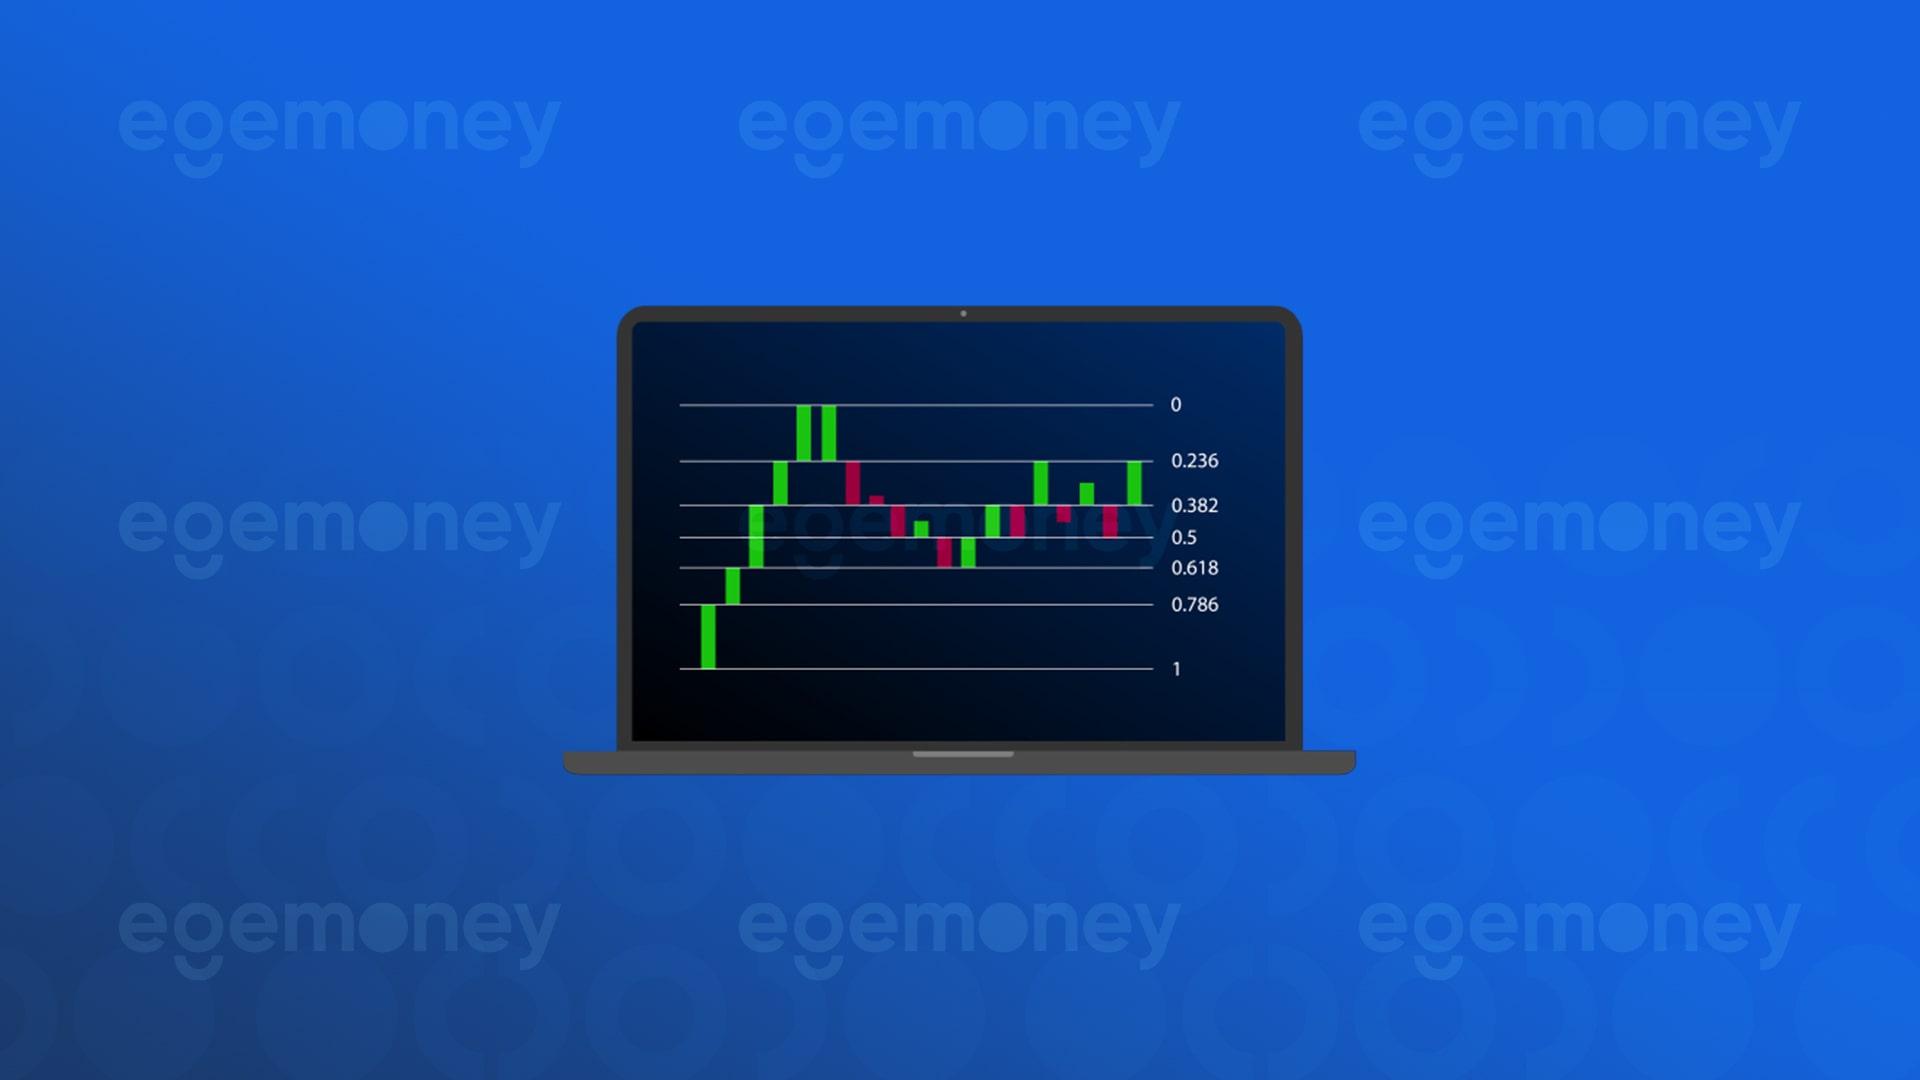
In the following chart, you can examine the working principles of Fibonacci retracement levels.
“In the rising trend, we see Fibonacci retracement levels starting from the 0 level and increasing downwards. If we evaluate these levels; they actually show us the support levels where the price can turn. The 0 level is the peak. After 0, the price level corresponding to the 0.236 Fibonacci level is where the price might turn in potential pullbacks. If the 0.236 Fibonacci level is broken, the next support level to follow is 0.382, which is an important retracement level. If the main trend is strong, the retracement is likely to end here. The 0.50 Fibonacci level is an intermediate level and there is potential to retract 1/3 or half of the previous trend before continuing in the main movement direction. 0.618 is also one of the significant levels. Breaking this level indicates that the declines might intensify. 0.786 can be considered as the first retracement line for a potential new trend. The 1 level is also considered the bottom level.”
Fibonacci Numbers and the Golden Ratio
The Fibonacci sequence is a series of numbers where each number is the sum of the two preceding ones. This sequence starts with zero and goes on indefinitely: 0, 1, 1, 2, 3, 5, 8, 13, 21, 34, and so forth. Interestingly, the ratio of the numbers in this sequence, especially larger ones, approaches approximately 1.618, also known as the Golden Ratio. The Golden Ratio is known as a natural proportion commonly found in art, architecture, and nature. Fibonacci numbers and the Golden Ratio play a significant role in analyzing price movements in financial markets.
Effective Use and Limitations of Fibonacci Retracement Levels
Fibonacci retracement levels are most effective when used in conjunction with other technical analysis tools and indicators. For example, a trader might use Fibonacci retracement levels together with momentum indicators like the RSI (Relative Strength Index) or the MACD (Moving Average Convergence Divergence) to obtain stronger trading signals. However, Fibonacci retracement levels may not always provide accurate predictions depending on market conditions and other factors.
You may be interested: “What Are the Best Trend Indicators?”
Fibonacci retracement levels tend to work better in high-volume and liquid markets. These levels may be less reliable in markets with low volume or less liquidity. Moreover, the use of these levels can be seen as a result of market psychology and collective trader behavior. Many traders and investors might be using these levels, therefore movements at these levels can partly be self-fulfilling prophecies.
Practical Applications of Fibonacci Retracement Levels
Practical applications of Fibonacci retracement levels can be observed especially in stock, foreign exchange (forex), cryptocurrency, and commodity markets. For instance, after a cryptocurrency experiences a significant increase in price, traders can use Fibonacci retracement levels to determine the potential support levels for this cryptocurrency. If the cryptocurrency finds support at one of these Fibonacci levels, it can be an opportunity to buy for traders. Conversely, if the cryptocurrency falls through these levels, it can be interpreted as a sell signal.
In conclusion, Fibonacci retracement levels are a powerful tool in technical analysis and, when used correctly, can help investors and traders better understand market movements and make more informed trading decisions. However, it is important to be aware of the limitations of this tool and to use it in conjunction with other technical indicators and market analysis methods.
The information presented in this article is for general informational purposes and does not constitute any investment advice. Readers are advised to conduct their own research and consult a professional financial advisor before making financial decisions.

Research Specialist at EgeMoney
My areas of expertise include fundamental and technical analysis, portfolio management, risk analysis, and market research. Adapting to rapidly changing market conditions and producing reports are among my top priorities. Through my research on the EgeMoney platform, I aim to shape your financial future and add value to your decision-making processes.