EgeMoney ITB Predictions is an analysis method for EgeMoney users that offers one-hour price predictions within the ITB Platform. With this feature, users can review price predictions based on the crypto assets.
ITB is a platform that produces crypto prediction models. The platform using technological innovations inspired by artificial intelligence. There is over 50 TB of crypto prediction data within the platform. ITB provides a completely transparent service to users with the accuracy statistics of its predictions. In this article, we will explain how to access ITB Predictions.
How To Access and Use ITB Predictions
 After accessing the EgeMoney website, you should click on the “ITB Analysis” button under the “Analytics” heading in the menu above. The page that comes up consists of a menu with predictions charts.
In the menu on the left, you will see the currency unit of each cryptocurrency. This menu contains all cryptocurrencies whose data is available.
 If you want to access the analysis of which cryptocurrency, simply click on that currency. For example, you can click on BTC for Bitcoin and ETH for Ethereum. The data of the unit you clicked will appear on a chart.
On this page you access, there are two different types of analysis, QuickView and Prediction. To access the ITB Analysis/Predictions mentioned in this article, you should click on the second Option “Prediction” button from the top menu on the far right of the page.
 By clicking this button, you can access the page you want, ITB Predictions. The following chart shows IntoTheBlock’s enhanced one-hour directional price predictions for the next.
 What can I see in the dashboard?
The dashboard that comes up is a chart designed on the price predictions. This dashboard includes the current and last four time period predictions.
The title “Prediction Accuracy” shows the reliability rate of the predictions. You can see the weekly correct predictions here. In the next section, you will only see the price prediction specific to the day you are viewing.
With the “See More” button, you can visit the IntoTheBlock site.
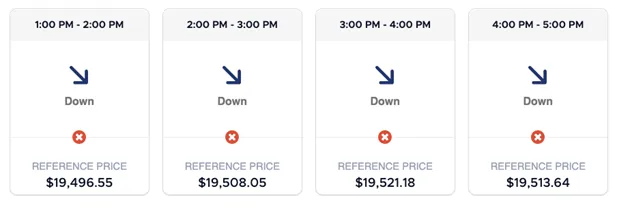
The hour charts you see at the bottom show price predictions for a range of hours.
“Down” means that the value of the crypto asset you selected has decreased relative to the target.
 “Neutral” means the crypto asset you selected stayed within a distance of the current target during that hour.
 “Up” means the value of the crypto-asset you selected will increase according to the target.
How can I see the prices?
At the bottom of the hour charts, you’ll see the reference prices. This shows the price at which the target was taken. Shortly, these price estimates appear in the simplest form. You can examine the accuracy of the estimates according to the last hours you want. You can see that there is time left until the next prediction.
On this analysis page, you can examine the price predictions of the cryptos. ITB has a transparent infrastructure. Don’t forget to visit EgeMoney and our blog page to find out more!


 What can I see in the dashboard?


