The Elliott Wave Theory is one of the most popular technical analysis methods used for forecasting in financial markets today. Today, this principle is used in many markets both to determine the future and to take the right steps as well. It has an impact in different areas such as income-expenditure balance, price increase / decrease analysis, stock and cryptocurrency sector. In this guide, we will examine how to use the Elliott Wave Theory Analysis Tool available on the EgeMoney Exchange website.
Access to Elliott Wave Theory via EgeMoney
When you click to the “Analytics” heading in the menu on the EgeMoney website, you should click on the Elliott Analysis section and log in to the https://egemoney.com/en/analytics/BTC link. The chart that comes up allows you to see the cryptocurrency you want.
For example, to check Bitcoin, simply click on Bitcoin (BTC) in the left menu. Likewise, when you click on the title that says Ethereum (ETH) for Ethereum, you will see the chart belonging to Ethereum. In short, whatever coin you are looking for, you can reach the chart by clicking on that coin in the menu on the left. There are a total of 11 cryptos on the page, including BTC, ETH, BNB, DOGE, XRP, LTC, BCH, TRON, ADA, XLM and SOL, and if you click on which one, you will reach its chart.
You can filter the dates and hours you want in the search bar at the top right of the page. This filtering feature helps you read ups and downs faster and analyze Elliott wave theory better. On the left side of the same line, the price and percentage of the currently selected cryptocurrency are seen.
You will see a different chart for each cryptocurrency you choose, this is because each cryptocurrency has different values, prices, ups and downs. Please note that you have to read different charts for each currency, and to access these charts, you must click on the unit from the menu on the left.
How To Read the Elliott Wave Charts In Detail?
To read the Elliott Analysis, you must first have a good knowledge of certain basic concepts and know what the parts of the charts are for.
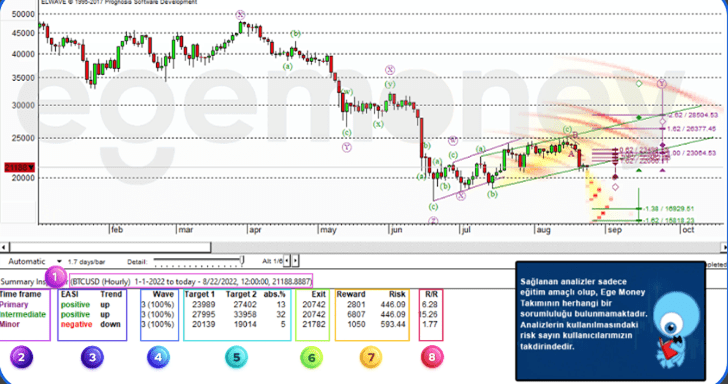
Section 1 shows which currency you are reading and what time period you have filtered for the value (price) of that currency. To change the filter date, you can click on the date section at the top right of the page. To change the cryptocurrency, just click on the currency you want from the menu on the left, as we mentioned above.
Section 2 (Time Frame) is the unit of time that goes from the general to the specific. The time frame starts from the long term and goes towards the short term. Whatever time period you want to search, just click on it.
Section 3 (EASI & Trend) indicates the overall result you will get from the analysis and determines whether the market for your chosen coin is negative. The direction of the followed cryptocurrency in a certain period of time is called the “trend”. If “up” is written in the trend section, we can understand that this coin is on the rise, if it is written “down”, it is in a decline. Of course, you should pay attention to which time filter you look at in these analyzes. A currency that decreases days ago can suddenly increase within a day.
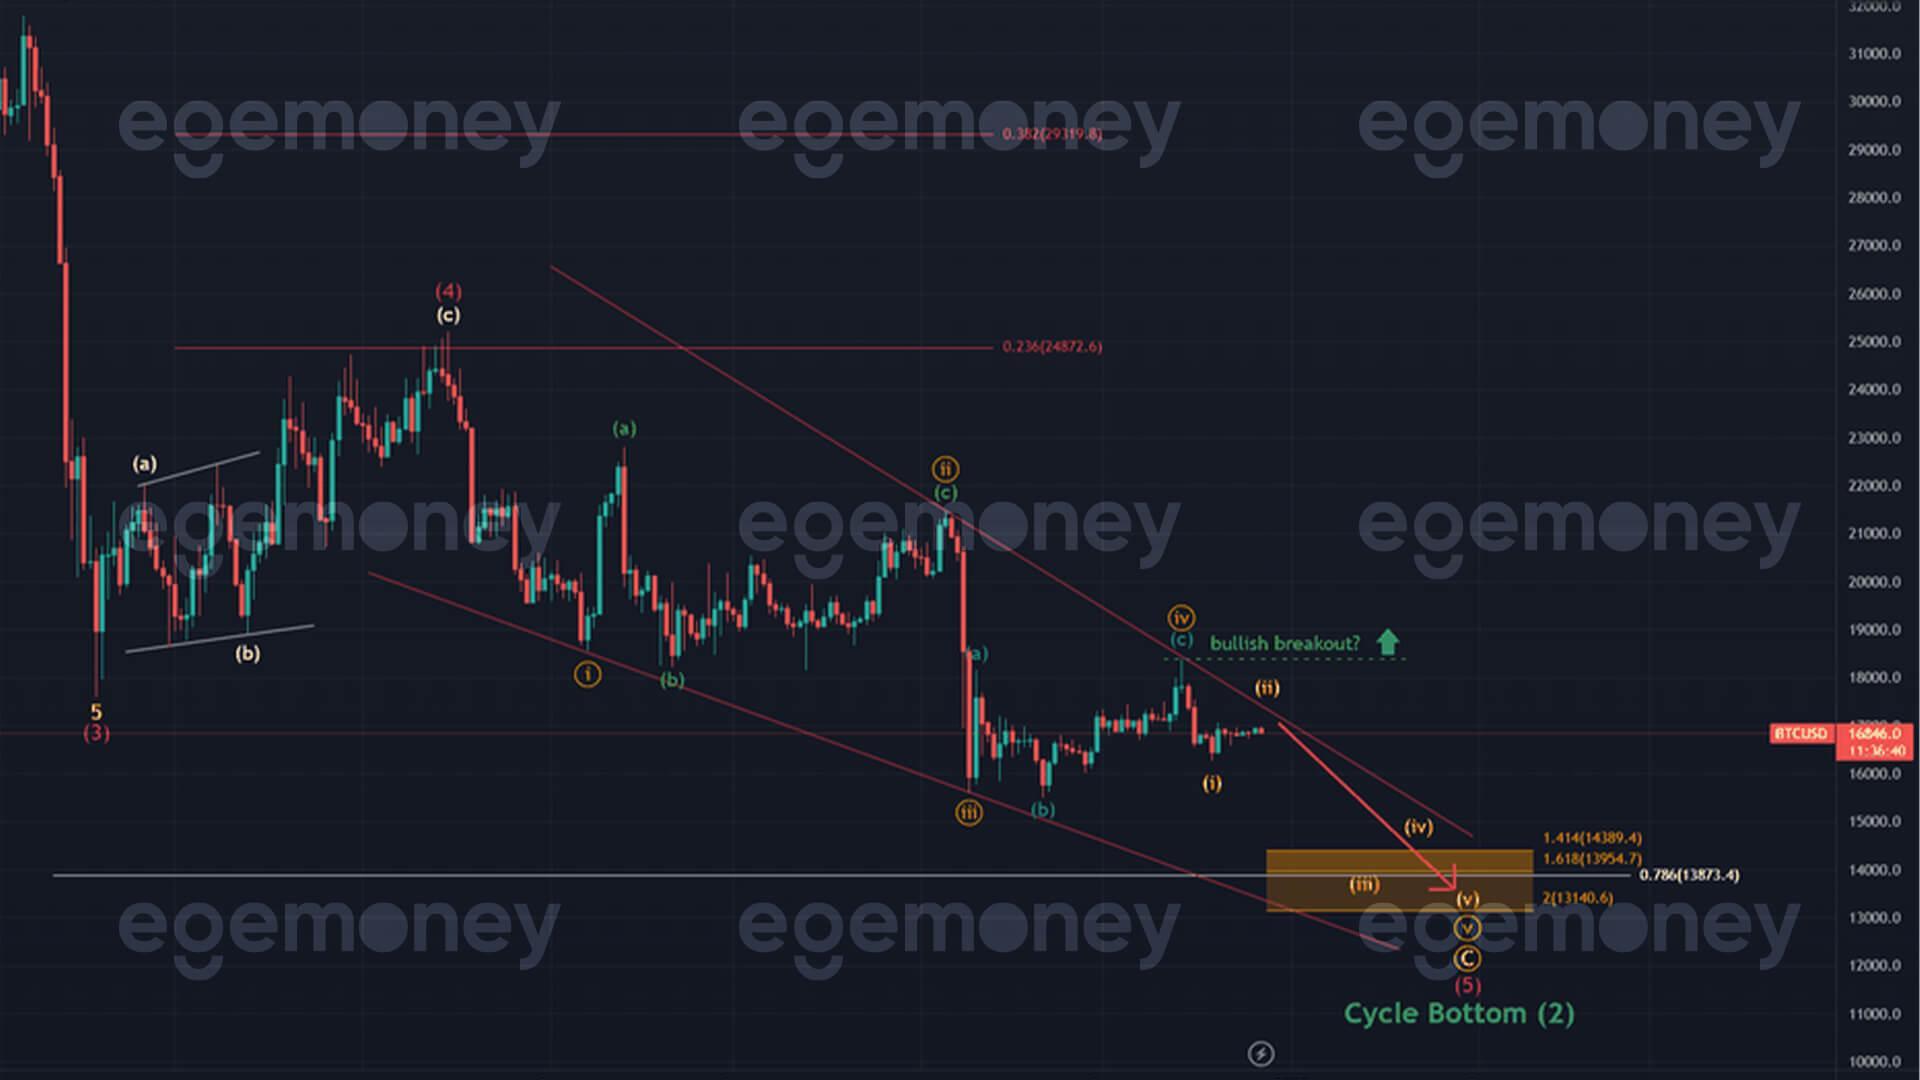
Section 4 (Waves) is the analysis of waves, which forms the basis of the Elliott Wave Theory. As we mentioned before, the best takeaway from these analyzes is in waves 3 and 5 on the chart. These waves are impulsive waves”. Waves such as 2, 4 are the corrective waves that follow. You’ll get the best predictions from Waves 3 and 5, but keep in mind that correction waves are also important for analysis in a general chart reading.
Predicting waves 3 and 5 will often bring you the best payoff. The pattern for the forecast is pretty simple: you can read from the chart when Wave 3 and 5 will come, by thinking of these wave patterns as a repeating pattern all the time (in a period, of course). That’s why it’s so important to count correctly in the waves you’ll be looking at as you read the chart.
As we mentioned before, according to the Elliott Wave Theory, changes in financial markets are not always in the same direction. Developments do not follow a continuous rhythm. However, price changes always maintain a clear structural order. Since the waves you will see in chapter 4 are the basis of a certain pattern, you can make a prediction by constantly thinking about these waves.
Target 1 and Target 2 headings, which you will see in section 5, determine 2 types of targets: Conservative Target and Aggressive Target. If you want to open a position with less risk, you should consider the data under the heading Target 1.
Section 6 includes stop loss or exit point calculations according to the Elliott Waves under the “Exit” heading. A stop loss is an automatic order that you can place when you take a loss. For example, if the money you have decreases below a certain level and this will cause you more losses over time, you will automatically sell after a level with a stop loss point. When you make a sale, your loss stops. This is a safe option to insure yourself (mostly).
The Reward-Risk headings you see in section 7 indicate your rewards and risks. In the Reward heading, you will see how much profit you will make as a result of the achievement of the situation you have targeted. On the risk side, you will see how much you will lose if you make a loss or place a stop loss order. It is important to read this part carefully, because if the ratio of reward to risk does not inspire confidence, you can incur big losses.
Section 8 is the calculation of the Reward/Risk (R/R) ratio in number 7. This calculation explains whether it’s worth the risk you’re taking. This risk-reward calculation is something we do all the time in our real life. For example, Imagine being offered 10 thousand Turkish Liras in exchange for jumping from a high place. The idea of breaking or injuring yourself may not be on your mind. But when offered 1 million Turkish lira, most people are willing to take the risk because of the size of the prize. The logic of the calculation in this case is quite simple: the reward should always be greater than the risk taken.
To use the Elliott Analysis Tool on the EgeMoney website, you must be familiar with the concepts and terms that we have mentioned above. Once you understand what all the titles and sections are for, all that’s left is to choose and check the cryptocurrency you want. After reading the waves, you can learn more about the patterns from our article on Elliott Wave Principle and you can predict the pattern and make a safe investment accordingly. The R/R value should be greater than 1 for the best estimate. But if this ratio is greater than 8, the reward is unrealistic, meaning it’s too good to be real.
Also, do not forget that you can access all these analyzes for free (as clients) with EgeMoney Analysis Telegram Bot, which is a simpler and easier way to read charts. Telegram Analysis Bot sends you the data of the crypto you want in 3 different time frames. In this way, you do not need to check all the time and you automate this work. For more information visit our; Elliott Analysis Page