
What are Triangle Chart Patterns?
Triangle chart patterns are a frequently used chart pattern in technical analysis. These patterns are created by the fluctuating price of a certain asset within a narrowing range. Triangle chart patterns are typically characterized by a horizontal support line and a downward sloping resistance line. As these lines converge, price movements become confined to a narrower area, which can be a significant signal for the continuation or reversal of a trend.
How Do Triangle Chart Patterns Work?
Triangle chart patterns are a technical analysis model used to analyze the price movements of an asset in financial markets. These patterns indicate a shift in the balance of power between buyers and sellers and are often a harbinger of significant price movement. Here’s a basic explanation of how triangle chart patterns work:
Price Contraction and Psychological Dynamics
- Triangle chart patterns represent a period when prices move in an increasingly narrowing range as a result of the actions of buyers and sellers. This contraction reflects a growing uncertainty and wait-and-see attitude among market participants.
- During the formation, the struggle between buyers and sellers causes prices to fluctuate between high and low levels. Each fluctuation occurs within a narrower range than the previous one, signaling that prices will break out at some point.
Breakout Point
- The most critical feature of triangle chart patterns is the ‘breakout’ moment towards the end of the formation. This is the point where prices clearly pass one edge of the formation (either the resistance or support line).
- The breakout represents a moment of decision in the market and usually occurs in a direction where either buyers or sellers clearly prevail. This movement indicates the exit of market participants from the uncertainty accumulated within the formation and the beginning of a new price trend.
Volume and Confirmation
- An increase in trading volume at the moment of breakout confirms the strength and validity of this movement. Increased volume shows the market’s commitment to the new price level and the importance of the breakout.
- The closing of prices above (in an upward breakout) or below (in a downward breakout) the broken trend line after the breakout helps confirm the formation.
Types of Triangle Chart Patterns
Triangle chart patterns are frequently used in technical analysis as graphical models that provide clues about the future direction of price movements. These patterns help investors understand market psychology and how the balance between demand and supply changes. Triangle chart patterns are divided into three main categories: symmetrical triangles, ascending triangles, and descending triangles.
Symmetrical Triangle Pattern
The symmetrical triangle pattern is a common chart pattern in technical analysis and usually forms before the continuation of a price movement. This pattern becomes evident on the price chart of a stock, index, commodity, or any other financial instrument. A symmetrical triangle is formed with price fluctuations within an increasingly narrow range, indicating uncertainty and indecision between buyers and sellers.
Key features of the pattern include the presence of two trend lines: an upper trend line and a lower trend line. These lines connect the low and high points of the price, respectively. The upper trend line slopes downward, representing a resistance level, while the lower trend line slopes upward, representing a support level. As these lines converge, prices are squeezed into a tighter area, signaling an imminent breakout.
The direction of the symmetrical triangle pattern typically depends on the trend in which it forms. If the pattern forms within an uptrend, the breakout is likely upward, considered a continuation pattern. Conversely, if it forms within a downtrend, the breakout may be downward, interpreted as a reversal signal. However, in both cases, the breakout direction is not definite and should always be assessed in conjunction with other technical indicators.
Ascending Triangle Pattern
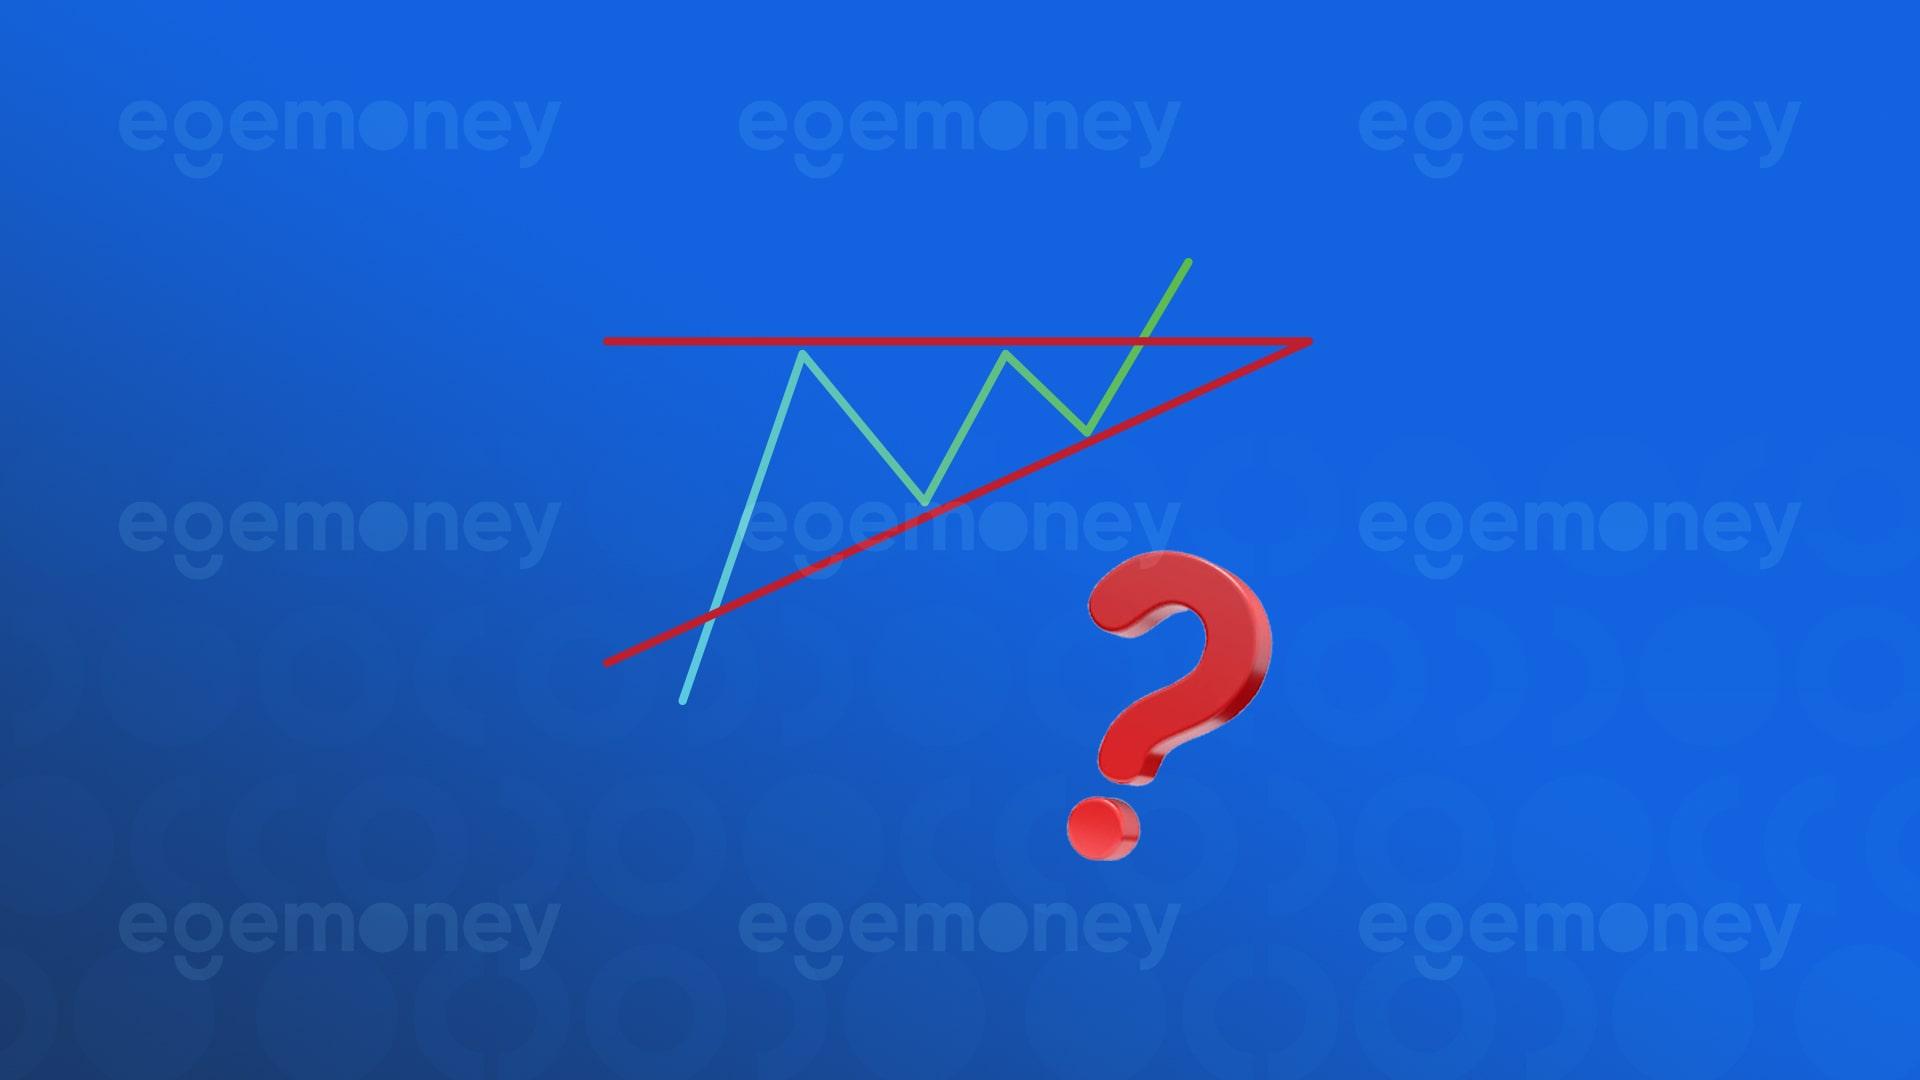
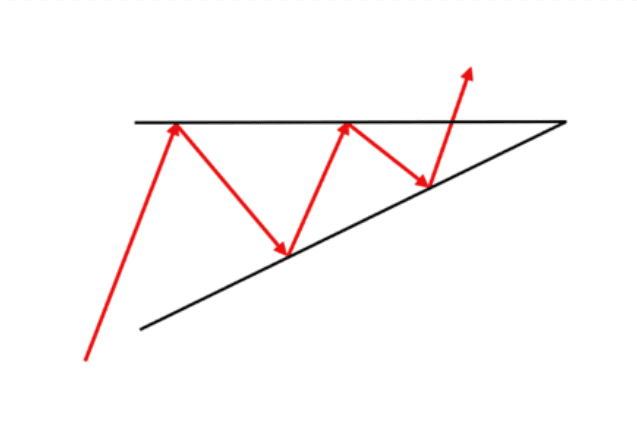
The ascending triangle pattern is a widely used chart pattern in technical analysis, generally regarded as a continuation pattern predicting an increase in the price of an asset. This pattern is visible in the price charts of stocks, indices, commodities, and other financial instruments. An ascending triangle pattern forms when prices encounter a progressively rising support level but fail to surpass a certain resistance level over a period.
One of the fundamental characteristics of this pattern is that prices consistently form higher lows, represented by an ascending trend line. This trend line forms the lower edge of the pattern and indicates strengthening buyers. On the other hand, prices consistently meet resistance at a specific upper level, the resistance point. This resistance level forms the upper edge of the pattern, showing strong presence of sellers at this level.
The ascending triangle pattern typically forms during an uptrend and anticipates an upward breakout. This breakout usually occurs with prices moving above the resistance level, signaling that buyers have taken control and a further price increase is expected. Confirmation of the pattern often requires increased trading volume; that is, an increase in trading volume during the resistance level breach enhances the pattern’s reliability.
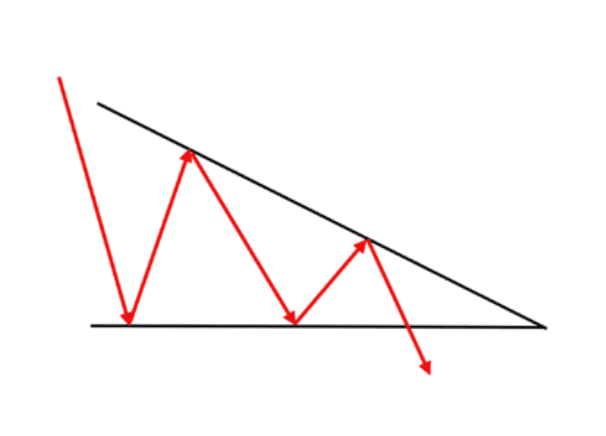
Descending Triangle Pattern
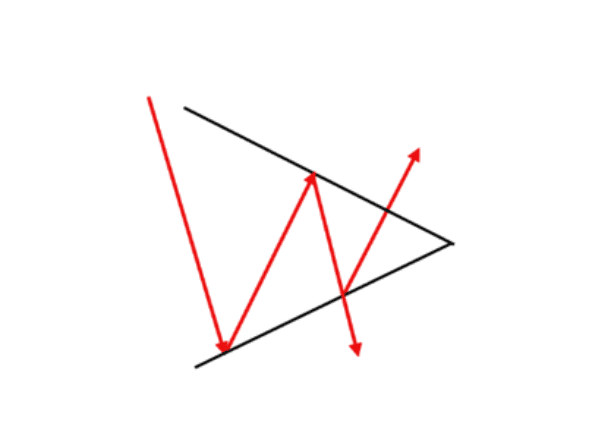
The descending triangle pattern is a significant chart model in technical analysis and is often considered a continuation pattern indicating a continuation of a downtrend. This pattern is observable in the price charts of stocks, indices, commodities, and other financial instruments. A descending triangle pattern forms when prices encounter a progressively falling resistance level but fail to break through a certain support level over time.
A key feature of the descending triangle pattern is that prices consistently form lower highs, represented by a descending trend line. This trend line forms the upper edge of the pattern, indicating strengthening sellers. Conversely, prices consistently meet support at a specific lower level, the support point. This support level forms the lower edge of the pattern, showing a strong presence of buyers at this level.
The descending triangle pattern usually forms during a downtrend and predicts a downward breakout. This breakout often occurs with prices falling below the support level, indicating that sellers have gained control and a further decline in prices is expected. Confirmation of the pattern usually requires increased trading volume; that is, an increase in trading volume during the support level breach boosts the pattern’s credibility.
Applying the descending triangle pattern in investment decisions requires a careful approach. Technical analysts may consider selling following the emergence of this pattern, but it is crucial to confirm the pattern and consider other market conditions.
Triangle Pattern and Investment Strategies
The triangle pattern is a powerful tool that can be used in investment decisions. Identifying this pattern can provide significant timing cues for buying and selling.
- Trading Signals: Determining the direction of the breakout of the pattern can provide buy or sell signals. For example, an ascending triangle pattern may be interpreted as a buy signal.
- Risk Management: The triangle pattern is also significant for risk management. Investors can use the lower and upper limits of the pattern as stop-loss and take-profit levels, respectively.
The triangle pattern is one of the most important tools in technical analysis and, when used correctly, can provide valuable insights into the future direction of the markets. However, like any technical analysis tool, the triangle pattern should be evaluated in conjunction with other market data and analytical methods.
This article has focused on the fundamental characteristics, types, and integration into investment strategies of the triangle pattern. It is important for investors to consider this information within the framework of their investment strategies and risk tolerance; EgeMoney cannot be held responsible. The information presented in this article is for general informational purposes and does not constitute any investment advice. Readers are advised to conduct their own research and consult a professional financial advisor before making financial decisions.
You may be interested in: “What is Cup Formation?“