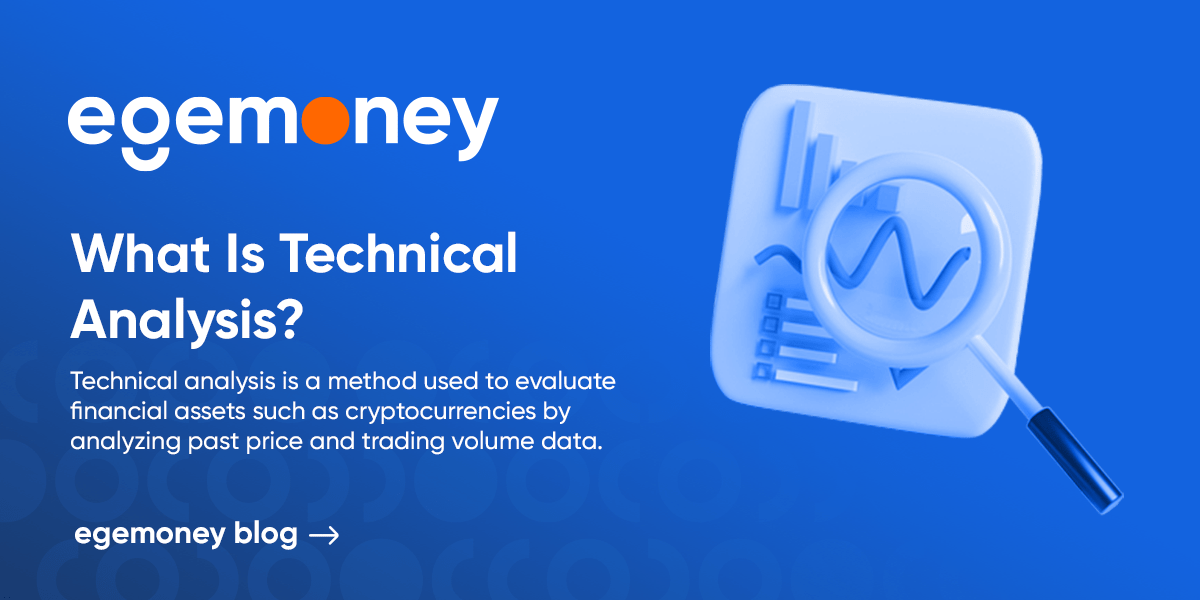
Technical analysis is a method used to evaluate financial assets such as cryptocurrencies by analyzing past price and trading volume data. It focuses on examining patterns, trends, and statistical indicators derived from market activity to predict future price movements. Individuals practicing technical analysis aim to identify potential trading opportunities and make informed investment decisions by studying charts and applying mathematical calculations.
Moreover, the underlying principle behind technical analysis is that historical price data contains valuable information about market behavior and psychology. Technical analysts strive to identify recurring patterns and trends that may assist in predicting future price movements by studying past price patterns and volume activities. Unlike fundamental analysis, which requires extensive data and information research, technical analysis relies heavily on mathematical calculations and analytical skills and can be evaluated in two main categories: charts and indicators.
Analysis of Chart Patterns
When looking at the price chart of a cryptocurrency, you can observe that the price moves up and down over time. Chart pattern analysis is used to examine these price movements and identify potential trends in future price behavior.
For example, one can mention the “head and shoulders” formation. As the name suggests, this pattern indicates three peaks, with one being in the middle. You can visualize this pattern as a mountain peak with two adjacent peaks. This pattern is often seen as a sign that the price may “drop” in the future. Therefore, if you notice this pattern, you may consider selling or not buying that particular cryptocurrency.
On the other hand, one of the most commonly used chart interpretation patterns is the ascending or descending triangle formation. In the ascending triangle pattern, lines drawn form triangles, and in the final breakout, an ascending trend follows, indicating that buyers are more active than sellers and potentially signaling a buying or holding opportunity.
Conversely, in the descending triangle position, the first triangle formed has its peak as the longest, and the subsequent triangle peaks gradually decline. At the final breakout point, the line is expected to enter a downward trend.
Chart pattern analysis helps traders and investors make decisions based on what they see on price charts. By recognizing these patterns, they attempt to predict whether the price will rise, fall, or remain stable. While chart patterns can provide significant advantages, it is important to remember that they are not infallible. They do not guarantee future price movements, and other factors such as news or market conditions should be carefully researched.
Utilizing Indicators
Indicators play a crucial role in the field of technical analysis as they are tools or calculations that help traders and investors understand price movements of financial assets such as cryptocurrencies. Simply put, you can think of indicators as clues and signposts that you can use on crypto charts.
Indicators employ mathematical formulas and calculations to analyze past price data and create visual representations such as lines or bars. These visual representations make it easier for you to interpret information and identify potential trends or patterns.
For example, one commonly used indicator is the Moving Average (MA), which calculates the average price over a specific period and plots it as a line on the chart. This moving average line helps determine the general direction of the price trend and can assist in identifying short-term fluctuations.
Another example is the Relative Strength Index (RSI), which measures the speed and change of price movements. It provides a number between 0 and 100, indicating whether an asset is overbought or oversold. This indicator can help you understand if a price reversal is likely to occur.
Another popular indicator is the Bollinger Bands, designed to provide information about price volatility and potential price reversals. The width of the bands expands and contracts based on market volatility. When the price is more volatile, the bands widen, and when the price is less volatile, the bands narrow.
How to Read Crypto Charts?
Crypto exchanges and trading platforms use candlestick charts to display price movements. These charts use green candles to represent price increases and red candles to represent price decreases. Investors can view these charts in different timeframes such as daily, weekly, monthly, or yearly to analyze both historical and real-time data.
Candlestick charts provide valuable information about market trends and assist traders in analyzing price fluctuations. Shorter timeframes are used to observe rapid price changes, while longer timeframes are often used to analyze long-term price trends.
Support and Resistance Levels
Support and resistance levels are essential concepts in technical analysis that help traders identify potential price levels where buying or selling pressure may emerge. A support level is a price level where buying pressure is expected to be strong enough to prevent further price decreases. It acts as a “floor” for a price where demand exceeds supply, and buyers are willing to enter the market. When the price approaches a support level, it provides traders with a potential buying opportunity, anticipating a reversal and upward movement of the cryptocurrency.
On the other hand, a resistance level is a price level where selling pressure is expected to be strong enough to prevent further price increases. It acts as a “ceiling” for a price where supply exceeds demand, and sellers are willing to sell the asset. When the price approaches a resistance level, traders see a potential selling opportunity, expecting the cryptocurrency to reverse and move downwards. Support and resistance levels are not fixed numbers but rather areas or zones where price reactions are likely to occur, determined by looking at previous price levels where the price reversed or halted. Furthermore, to facilitate the tracking of the conducted analyses, you can benefit from the Telegram Bot service provided by EgeMoney and have access to numerous useful content on our blog page.