Trend Indicators: What Are They?
Trend indicators are tools used in financial markets to help investors and analysts determine the direction and strength of existing price movements. These indicators analyze past price data and volume information to predict future price movements. Investors and traders use trend indicators to identify market trends, make buy and sell decisions, and manage risks.
Trend indicators are typically represented on charts as lines, histograms, or oscillators. These indicators rely on various mathematical calculations to capture patterns in price movements. For example, moving averages (SMA or EMA) calculate the average price over a specific time period and indicate the direction of the trend. Other indicators measure the speed or momentum of price movements.
Trend indicators assist investors in making more informed and knowledgeable decisions in the market, while also being an essential part of risk management and strategy development. Therefore, they are indispensable tools for many individuals trading in financial markets.
Here are some of the best trend indicators and their basic functions:
Moving Average
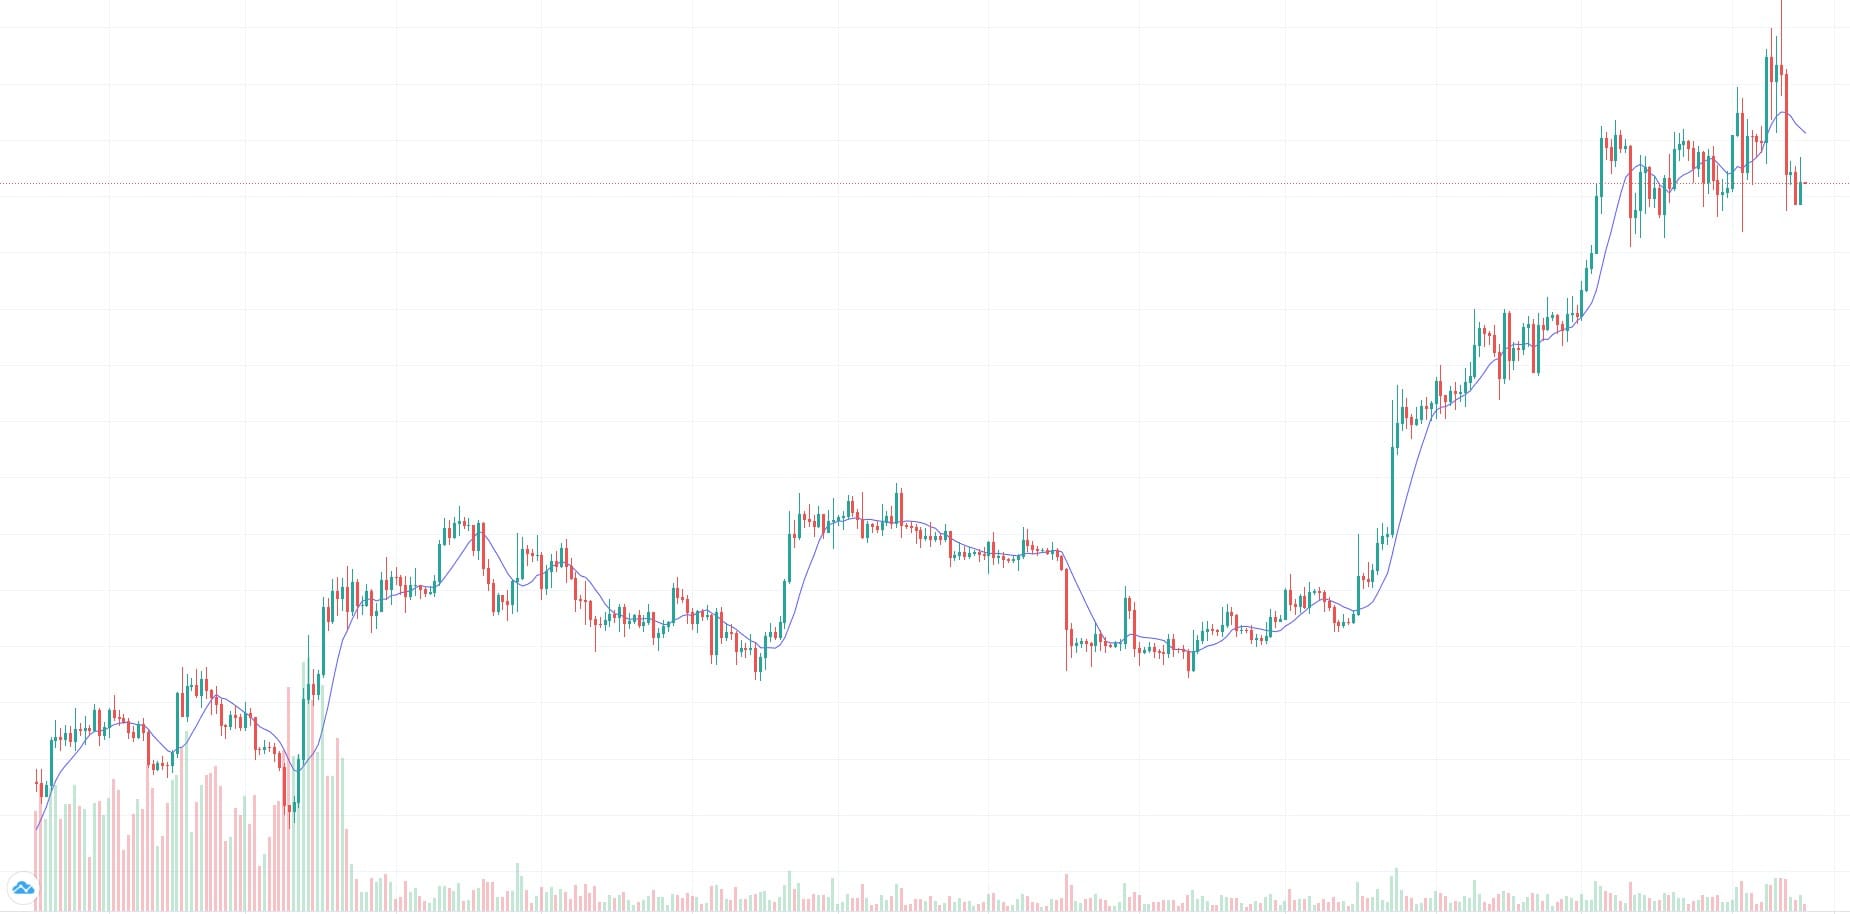
Moving average commonly used term in financial analysis and statistical calculations, this concept is used to smooth out fluctuations in data or better understand a trend.
Moving average calculates the average of a data series over a specific period. This period typically represents a specific time frame, and the average is calculated for data points within that timeframe. In financial markets, it is used to track fluctuations in data such as stock prices or exchange rates.
There are two types of moving averages: Simple Moving Average (SMA) and Exponential Moving Average (EMA).
- Simple Moving Average (SMA): This method calculates the weighted average of data points over a specific time period, with each data point having the same weight. It assigns equal importance to each data point, resulting in a more stable average.
- Exponential Moving Average (EMA): In this method, more weight is given to recent data points. This means that newer data is more important, and the moving average responds more quickly.
- Weighted Moving Average (WMA): This is a type of moving average that calculates the average of data points within a specific time frame using different weights. These weights are often used to give more importance to the most recent data. As a result, it emphasizes the latest data and reduces the influence of older data.
How to Calculate Moving Averages?
Calculating a moving average (MA) is quite simple and is used to understand trends in a general data set. Here is a simplified example explaining the MA calculation process:
- Select the Data Set: The first step is to choose the data set you want to analyze. For example, let’s say you want to calculate an MA for stock prices.
- Determine the Timeframe: Choose the timeframe for which you want to calculate an MA. For instance, let’s assume you want to calculate a 10-day MA.
- Sum the Data in the Chosen Timeframe: Add up the data points within the selected timeframe. For example, sum up the closing prices of the stock for the last 10 days.
- Divide the Sum by the Number of Time Periods: Divide the total sum of data points by the number of time periods you selected. This will give you the value of the moving average. For instance, after summing the closing prices of the last 10 days, divide by 10 to calculate the 10-day moving average.
- Update as New Data Arrives: As new days or periods pass, take the latest data point and calculate a new moving average by shifting the old data. This continuously updates the moving average with fresh data.
In summary, the process of calculating a moving average involves summing the data points within a chosen timeframe and dividing the sum by the number of time periods. This is a useful tool for identifying trends and smoothing data sets. You can choose different timeframes to predict long-term or short-term trends.
You might also be interested in: “What is Swing Trading?”
MACD (Moving Average Convergence Divergence)
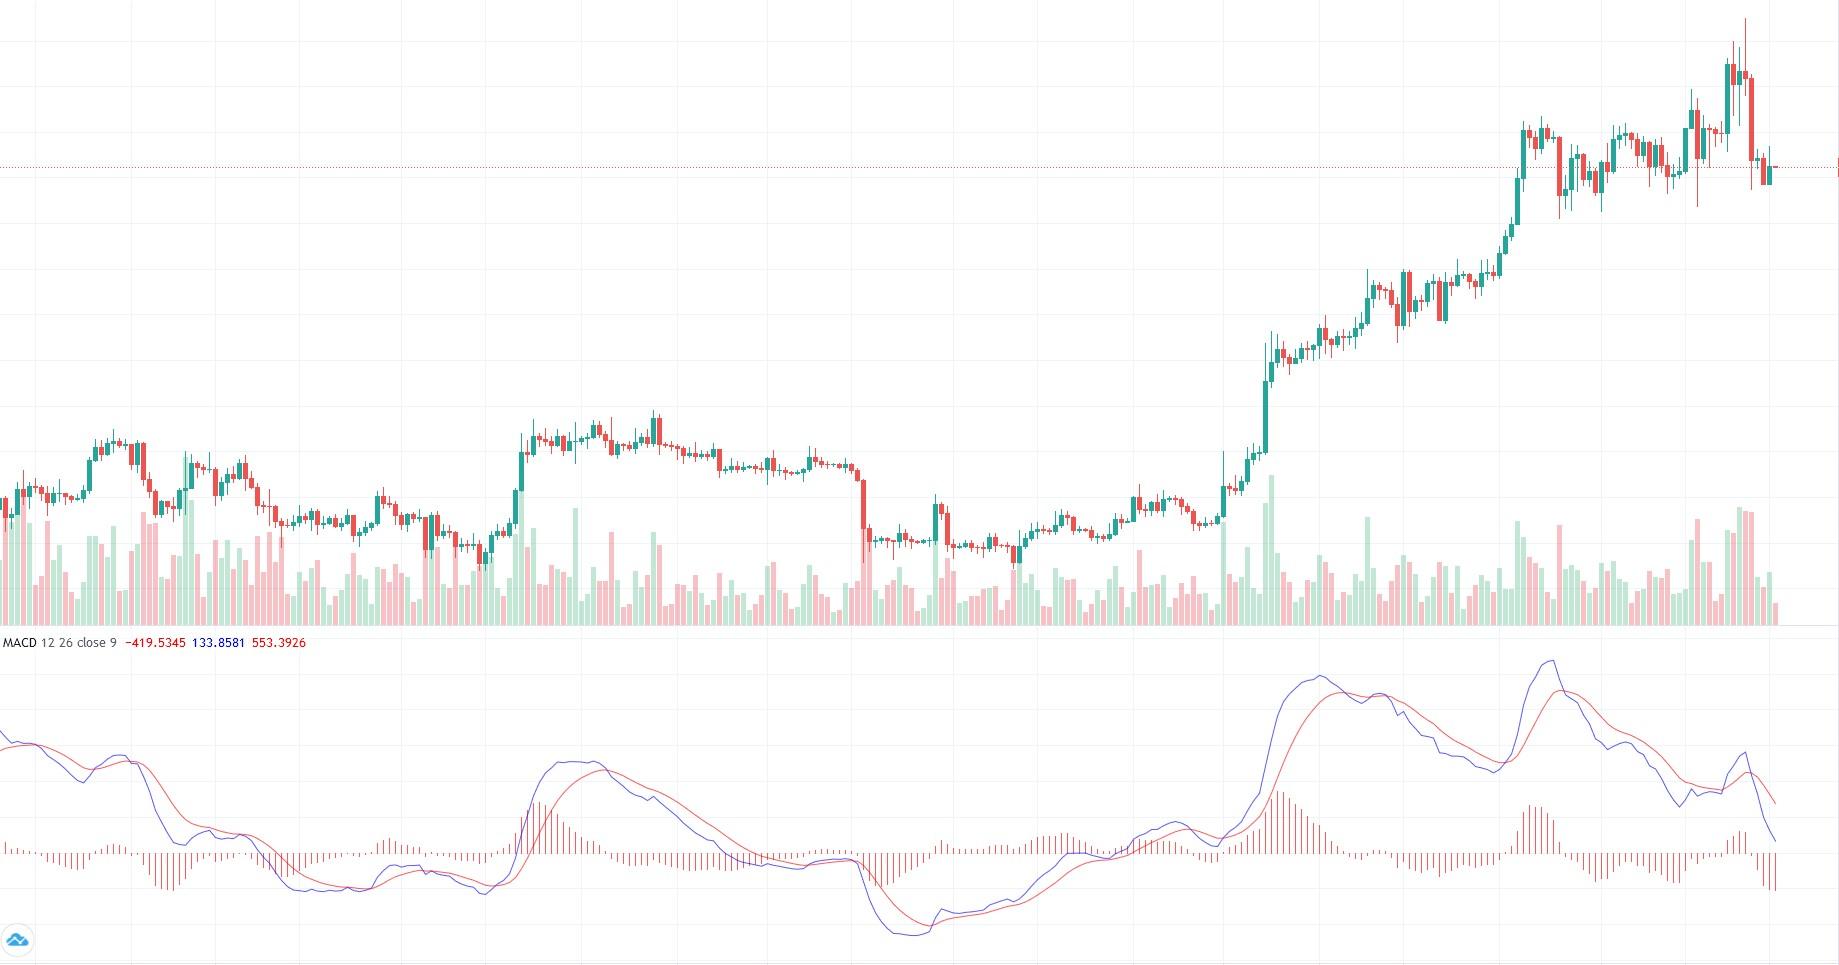
MACD, which stands for Moving Average Convergence Divergence, is an important indicator used in technical analysis in financial markets. The primary purpose of MACD is to determine the strength and direction of price movements. The basic components of MACD are as follows:
- Moving Average: The main component of MACD shows the difference between two different moving averages. Typically, 12-day and 26-day moving averages are used.
- MACD Line: Known as the main line of MACD, it represents the difference between the 12-day and 26-day moving averages. This line indicates how quickly short-term price movements change compared to long-term price movements.
- Signal Line: It is usually calculated with a 9-day moving average. The signal line smoothes the movement of the MACD line and is used to generate buy and sell signals.
Using the MACD Indicator:
- The intersections of the MACD line and the signal line generate buy and sell signals. When the MACD line crosses above the signal line, it is considered a buy signal. Conversely, if it crosses below the signal line, it is considered a sell signal.
- The crossing of the MACD line over the zero line indicates the strength of the trend. If the MACD line rises to positive values, it signifies a strong uptrend. Conversely, if it falls to negative values, it indicates a strengthening downtrend.
- MACD divergences and discrepancies can also be considered. If prices are making new highs while the MACD shows a downtrend, it can be a divergence indicating a potential weakening of the trend.
Bollinger Bands
Bollinger Bands are a technical analysis indicator commonly used in financial markets, often used to measure price volatility and predict future price movements. Bollinger Bands consist of the following three components:
- Middle Bollinger Band: This typically represents a 20-day moving average line and shows the medium-term trend of prices. It is a line that follows average price movements.
- Upper Bollinger Band: It is positioned above the Middle Bollinger Band and typically represents a value two standard deviations above. This line is used to indicate high volatility or overbought conditions.
- Lower Bollinger Band: It is positioned below the Middle Bollinger Band and typically represents a value two standard deviations below. This line is used to indicate low volatility or oversold conditions.
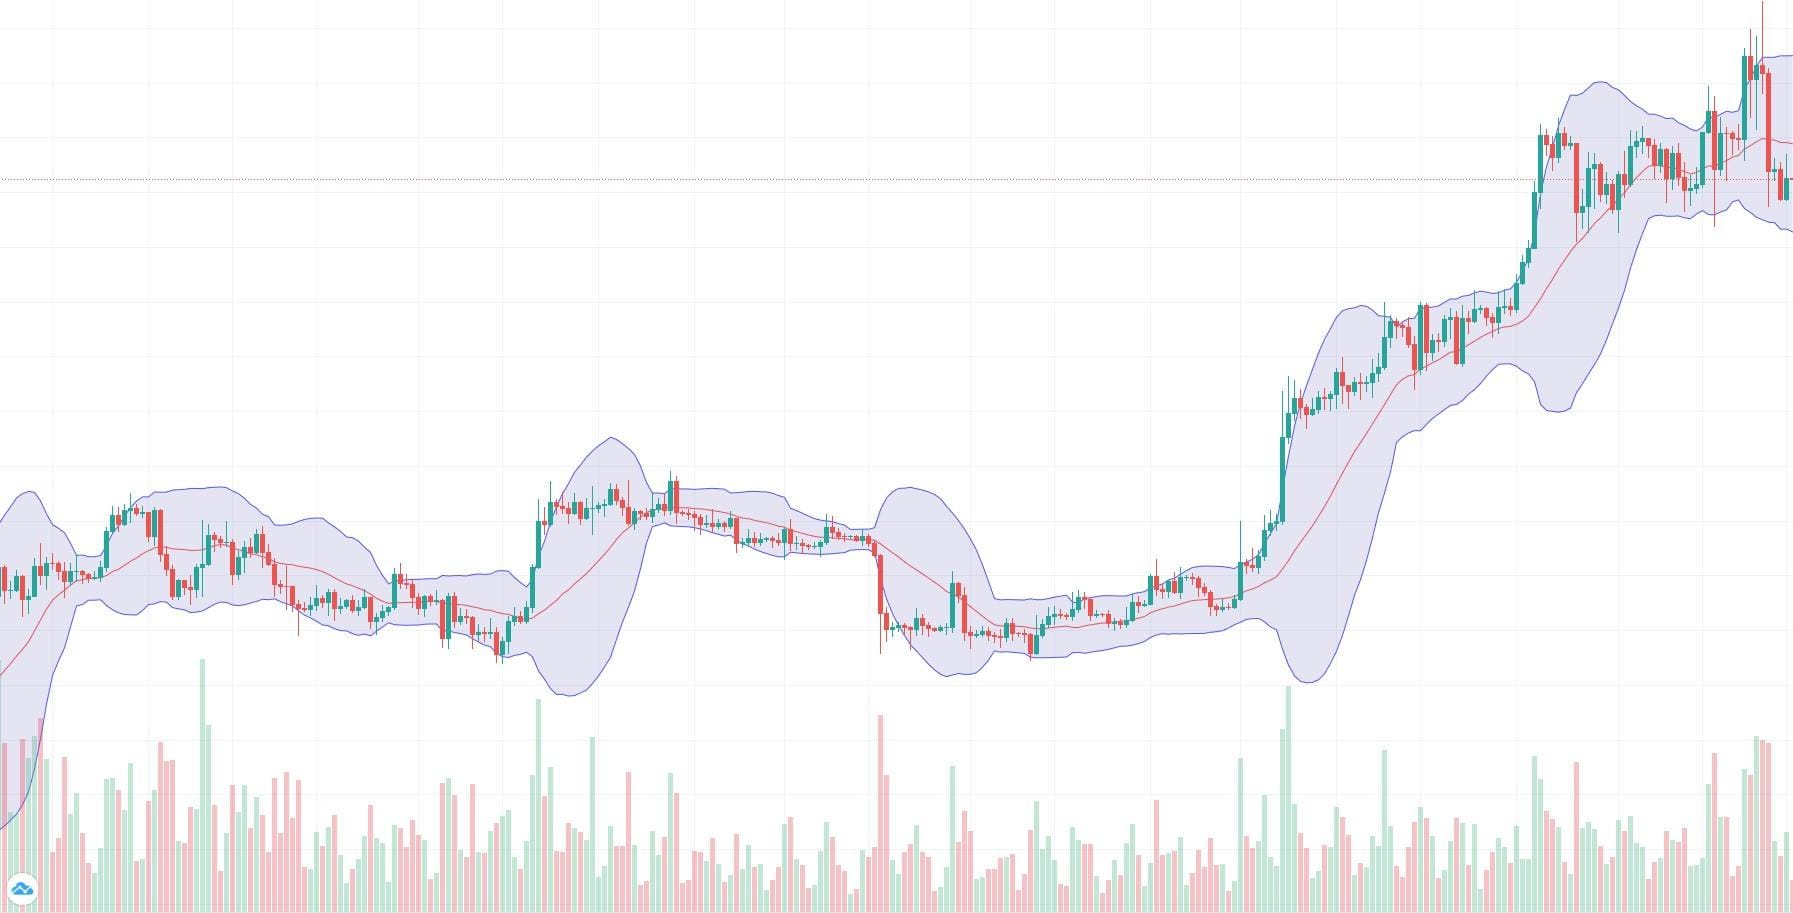
Bollinger Bands show the tendency of prices to move between these three bands. If the bands narrow, it indicates low volatility in the market, while widening suggests high volatility. Breaking above the upper band can indicate overbought conditions and a potential downtrend. Breaking below the lower band can indicate oversold conditions and a potential uptrend.
RSI (Relative Strength Index)
RSI, or Relative Strength Index, is a widely used technical analysis indicator in financial markets. RSI is used to evaluate overbought or oversold conditions of an asset and predict trend changes. The primary purpose of the indicator is to measure momentum by analyzing recent price movements of an asset and identifying overbought or oversold conditions.
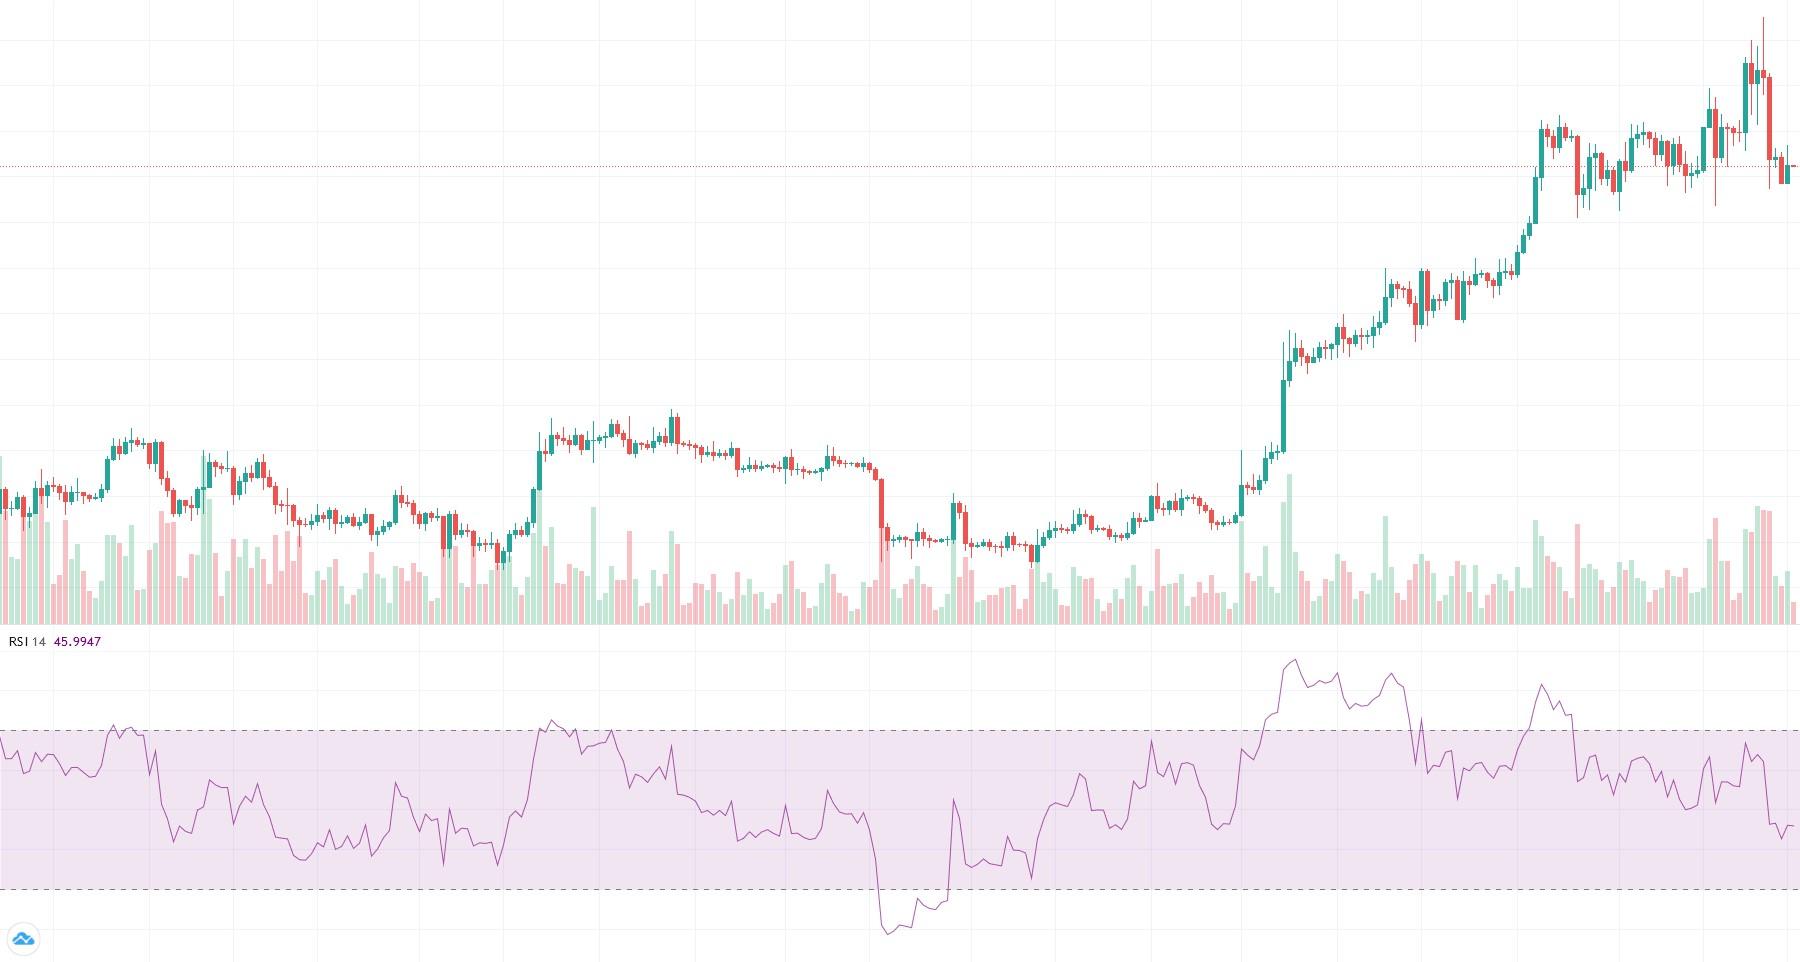
RSI is an oscillator that represents a value between 0 and 100. Typically, the levels of 70 and 30 are considered significant. If RSI crosses above the 70 level, the asset is considered overbought, and a correction or reversal may be expected. Conversely, if RSI falls below the 30 level, the asset is considered oversold, and an uptrend may be expected.
When calculating RSI, the average of increases and decreases over a specific period is taken, and an indicator value is generated based on this data. This helps traders and investors evaluate the strength of trends in the market and determine potential entry or exit points.
Stochastic Oscillator
The Stochastic Oscillator is a technical analysis indicator used in financial markets to assess overbought or oversold conditions of prices. This indicator, developed by George C. Lane, is calculated using the closing prices of an asset over a specific period.
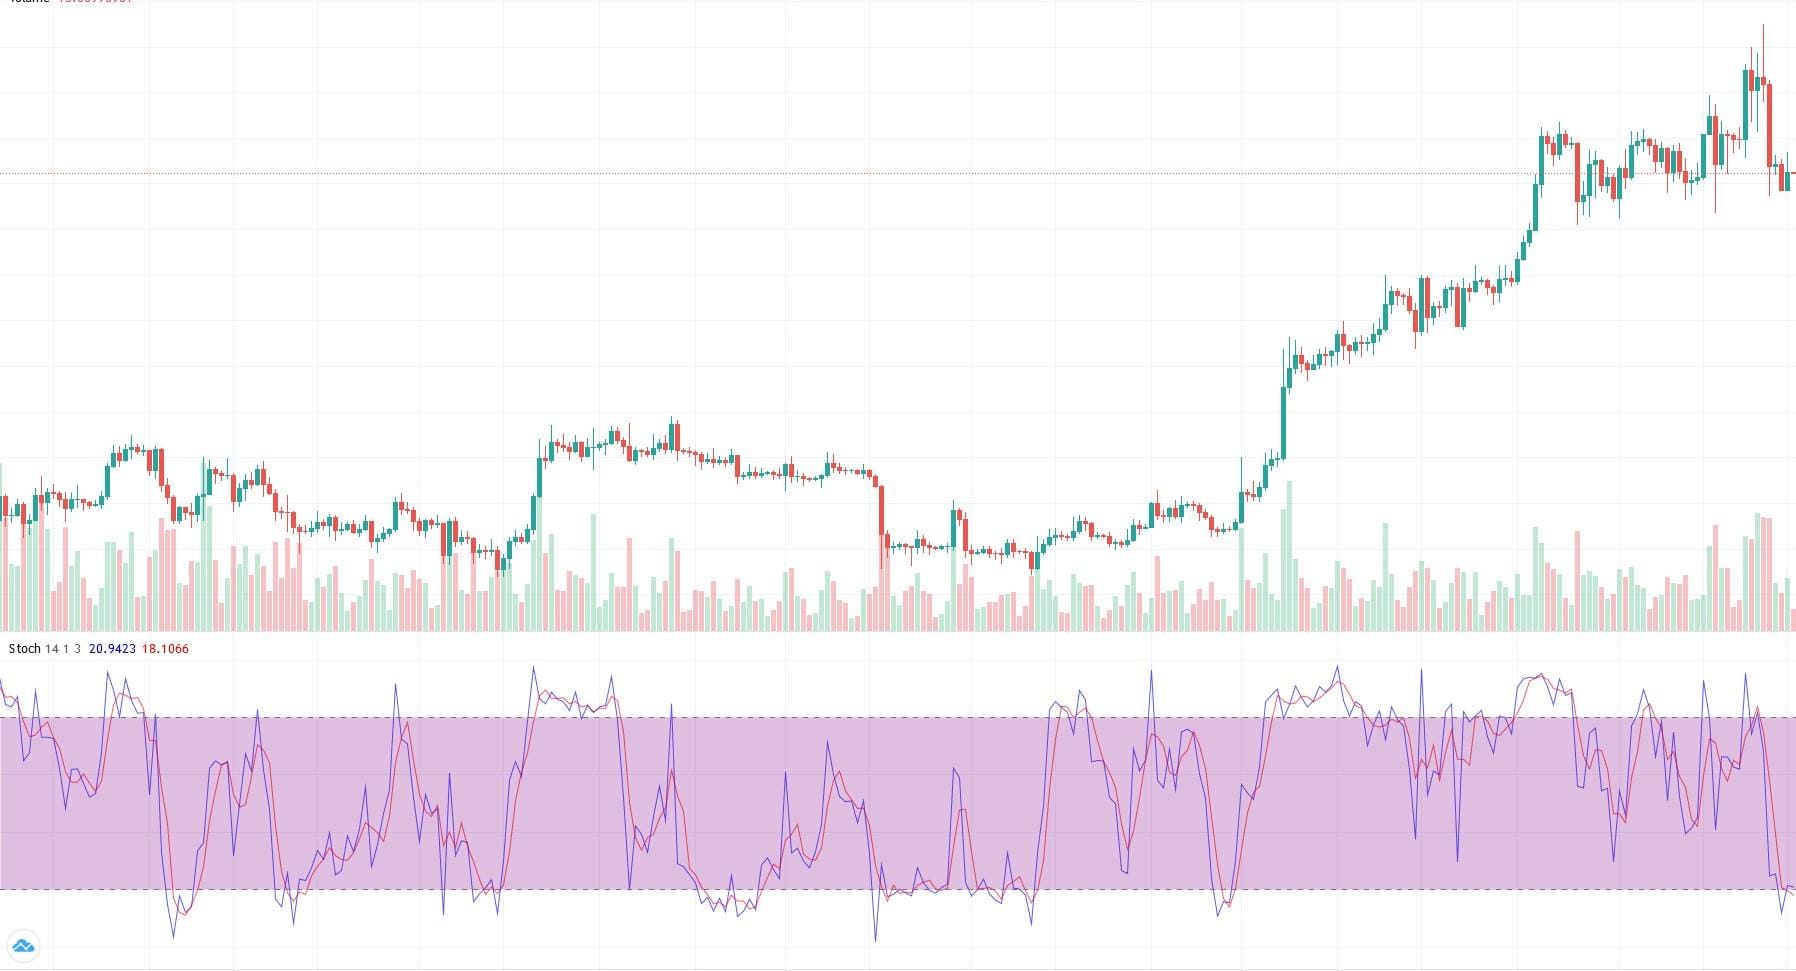
The Stochastic Oscillator functions as an oscillator representing a value between 0 and 100. It typically consists of two lines: a fast line (K) and a slow line (D). If the Stochastic indicator crosses above the 80 level, the asset is considered overbought, and a correction or reversal may be expected. Conversely, if the indicator falls below the 20 level, the asset is considered oversold, and an uptrend may be expected. The Stochastic Oscillator is used to generate potential buy or sell signals for traders and investors and to identify changes in market trends.
Fibonacci Retracement
Fibonacci retracement is a commonly used term in financial markets and is frequently employed in technical analysis. This analysis method utilizes Fibonacci numbers and ratios to determine correction levels in price movements and predict potential support or resistance points. The technique aims to assist in evaluating possible pullbacks and the likelihood of a trend continuing when a price chart exhibits a corrective move.
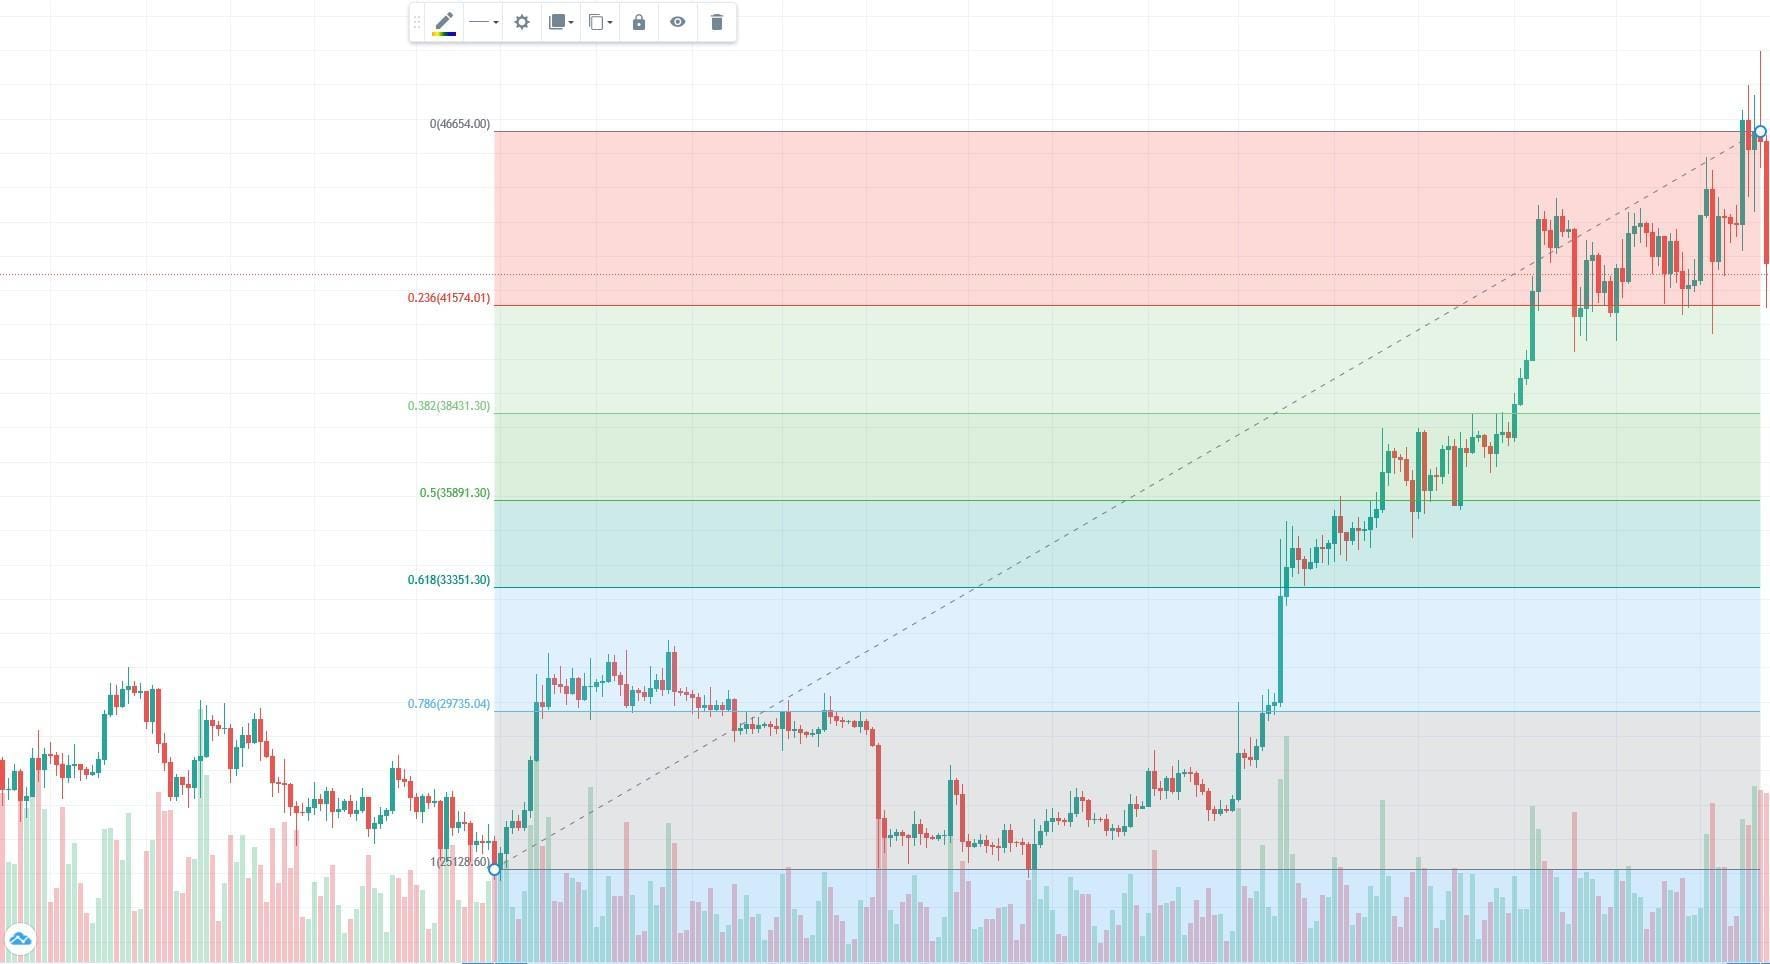
Fibonacci retracement is often applied when analyzing a price movement that occurs from a high price level to a low price level. Essentially, this method takes the price range from where a trend begins to where it peaks or starts a decline. This range is then divided by various Fibonacci ratios, resulting in the calculation of potential support or resistance levels.
Fibonacci retracement guides investors and traders in assessing retracements within trends and identifying potential trading opportunities. It is a significant tool for those conducting chart analysis in financial markets, aiding in predicting the probabilities of a trend continuing or reversing. Therefore, it is widely utilized among investors and traders as an analytical technique.
Ichimoku Cloud
Ichimoku Cloud is a Japanese-origin technical indicator used in financial markets and considered a crucial tool in technical analysis. The term ‘Ichimoku’ translates to “looking” or “observing” in Japanese, and this indicator is used to assess an asset’s price movements from a broader perspective. The Ichimoku Cloud stands out with its various components, which, when combined, form a cloud.
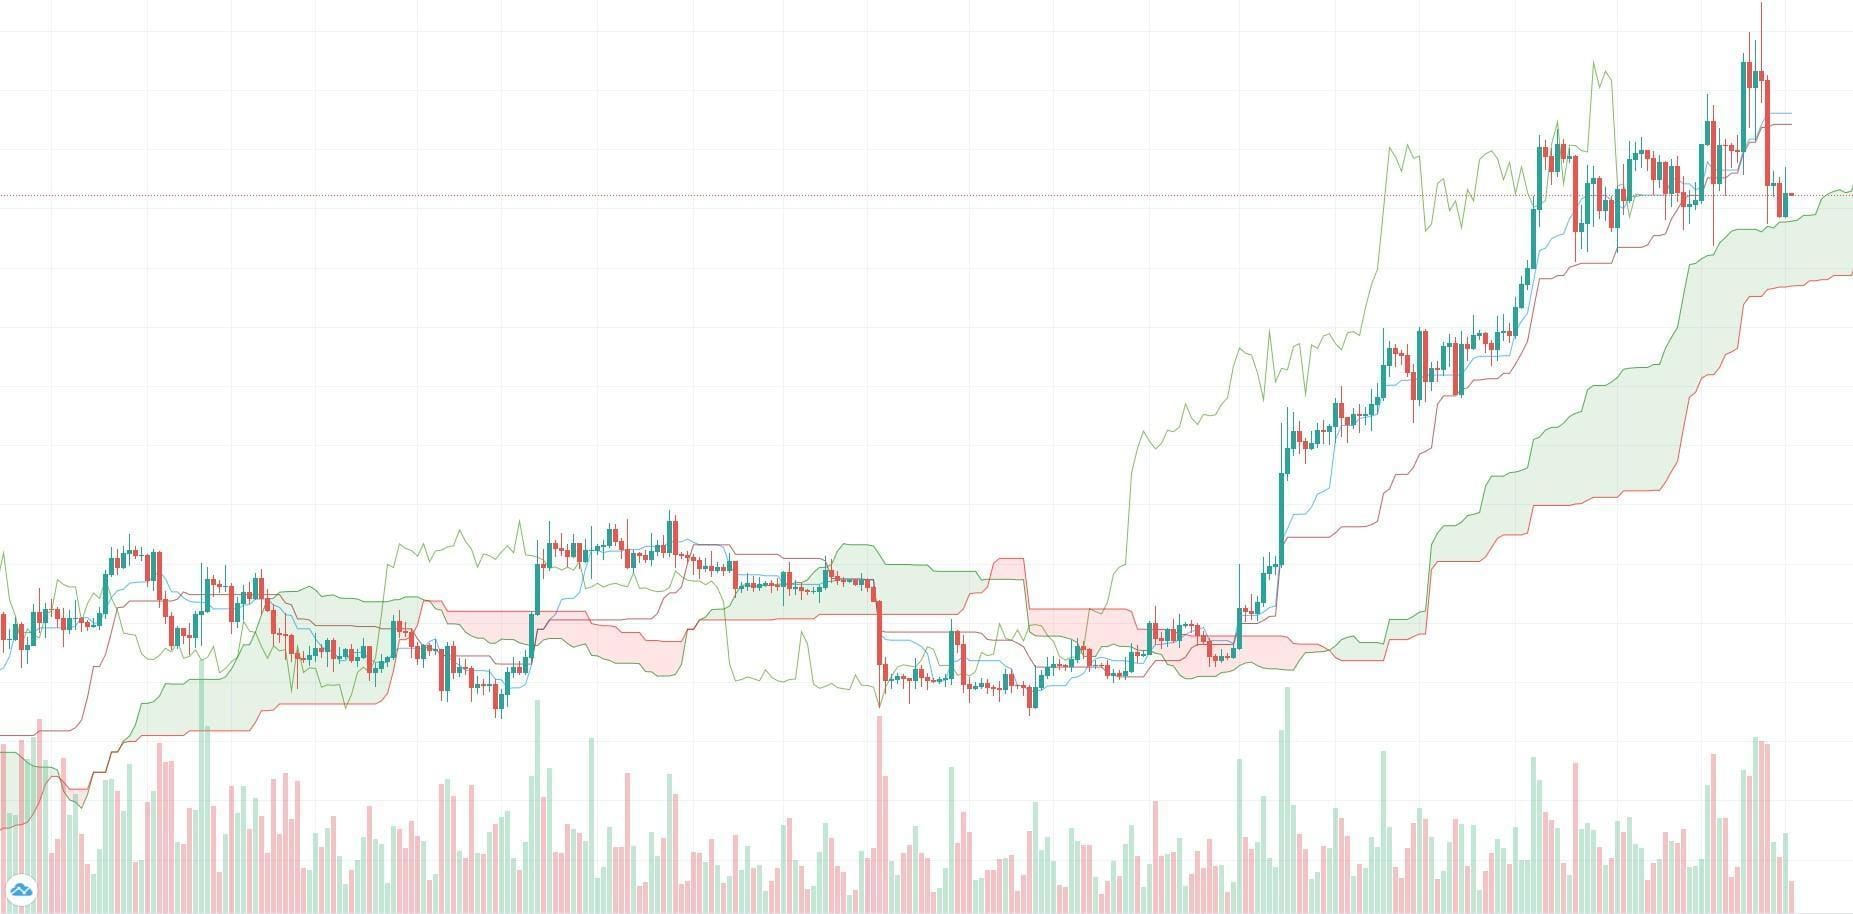
The fundamental components of the Ichimoku Cloud include Tenkan Sen (Conversion Line), Kijun Sen (Base Line), Senkou Span A (1st Cloud), Senkou Span B (2nd Cloud), and Chikou Span (Lagging Line). Tenkan Sen and Kijun Sen represent short-term and medium-term moving averages. Senkou Span A and Senkou Span B form the basis of clouds that indicate potential future support and resistance levels. Chikou Span acts as a backward-looking indicator of the current price.
The Ichimoku Cloud is considered an essential tool for traders and investors to identify trends, pinpoint potential buy or sell opportunities, and analyze market movements. This indicator represents a traditional approach rooted in Japanese analysis and serves as a valuable resource for those who seek to evaluate market behavior more comprehensively. Understanding and correctly using the components of the Ichimoku Cloud can enable more informed and strategic decision-making in financial markets.
Average True Range – ATR
Average True Range or ATR is a technical indicator used in financial markets designed to measure price volatility. ATR is utilized to determine how volatile the price movements of assets, including stocks, currency pairs, commodities, and others, are. It is also known as the Wilder’s Volatility Indicator, as it was developed by J. Welles Wilder Jr. and introduced in 1978.
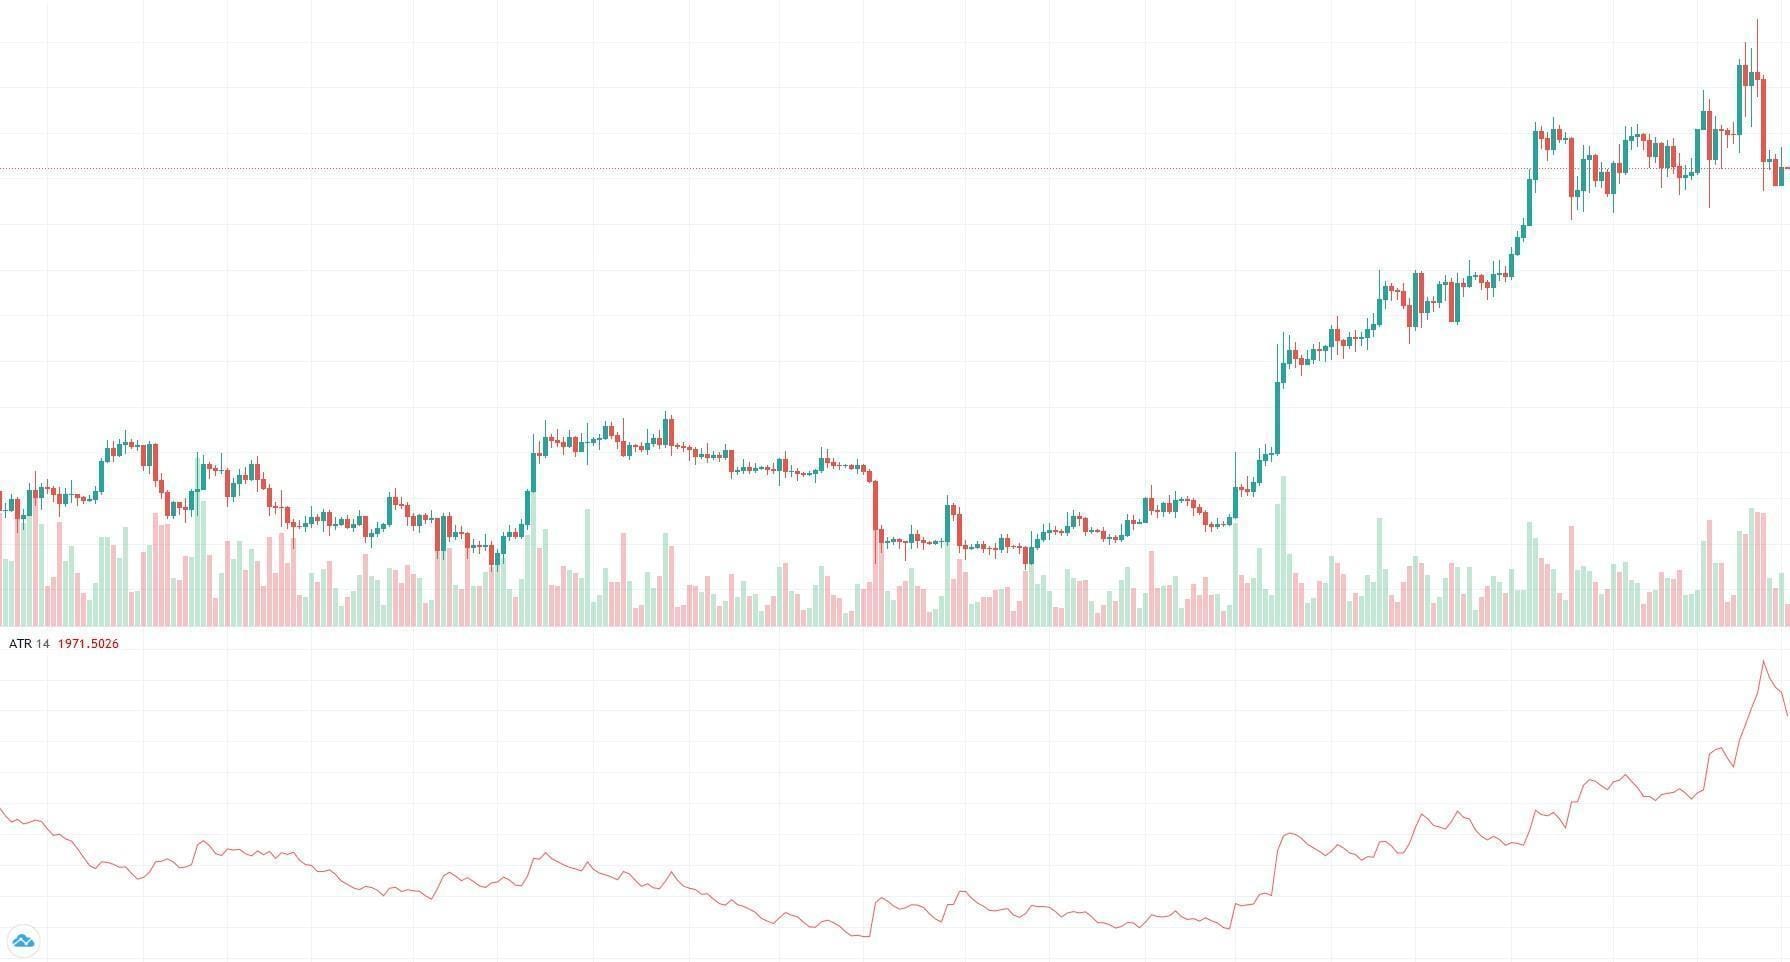
Calculating ATR involves measuring the differences between the highest and lowest prices over a specific period and converting these differences into an average value. This results in the calculation of the average true range of price movements. The ATR value can be used to gauge an asset’s volatility. A high ATR value indicates significant price fluctuations, while a low ATR value suggests more stable price movements.
ATR is important for traders and investors because it helps them understand market volatility and can assist in developing risk management strategies. It can be particularly useful when determining stop-loss levels and managing trading positions. Investors may opt for wider stop-loss levels in markets with higher ATR values, while narrower stop-loss levels may be preferred in markets with lower ATR values. This approach allows for minimizing potential risks and optimizing trading strategies.
The information presented in this article is for general informational purposes and does not constitute any investment advice. Readers are advised to conduct their own research and consult a professional financial advisor before making financial decisions.