Candlestick patterns are widely used in technical analysis to interpret price movements in financial markets, including the cryptocurrency market. These formations provide valuable information about market sentiment, trend reversals, and potential trading opportunities. Candlestick charts originated in Japan in the 18th century and have become a popular tool for analyzing price patterns. A candlestick chart represents the price movement of an asset within a specific time frame and is typically displayed in intervals such as minutes, hours, days, or weeks.
Components of a Candlestick Formation
Each candlestick chart consists of four basic components, which are as follows:
Opening Price: The opening price is the first price at which an asset is traded during a specific time period. It is represented by a thin line called the “wick” or “shadow” above or below the candlestick.
Closing Price: The closing price is the last price at which an asset is traded during a specific time period. It is represented by the colored or hollow body of the candlestick.
High Price: The high price represents the highest point that the price of an asset reached during a specific time period. It is depicted by the upper edge of the body or the upper wick of the chart.
Low Price: The low price represents the lowest point that the price of an asset reached during a specific time period. It is depicted by the lower edge of the body or the lower wick of the candlestick chart.
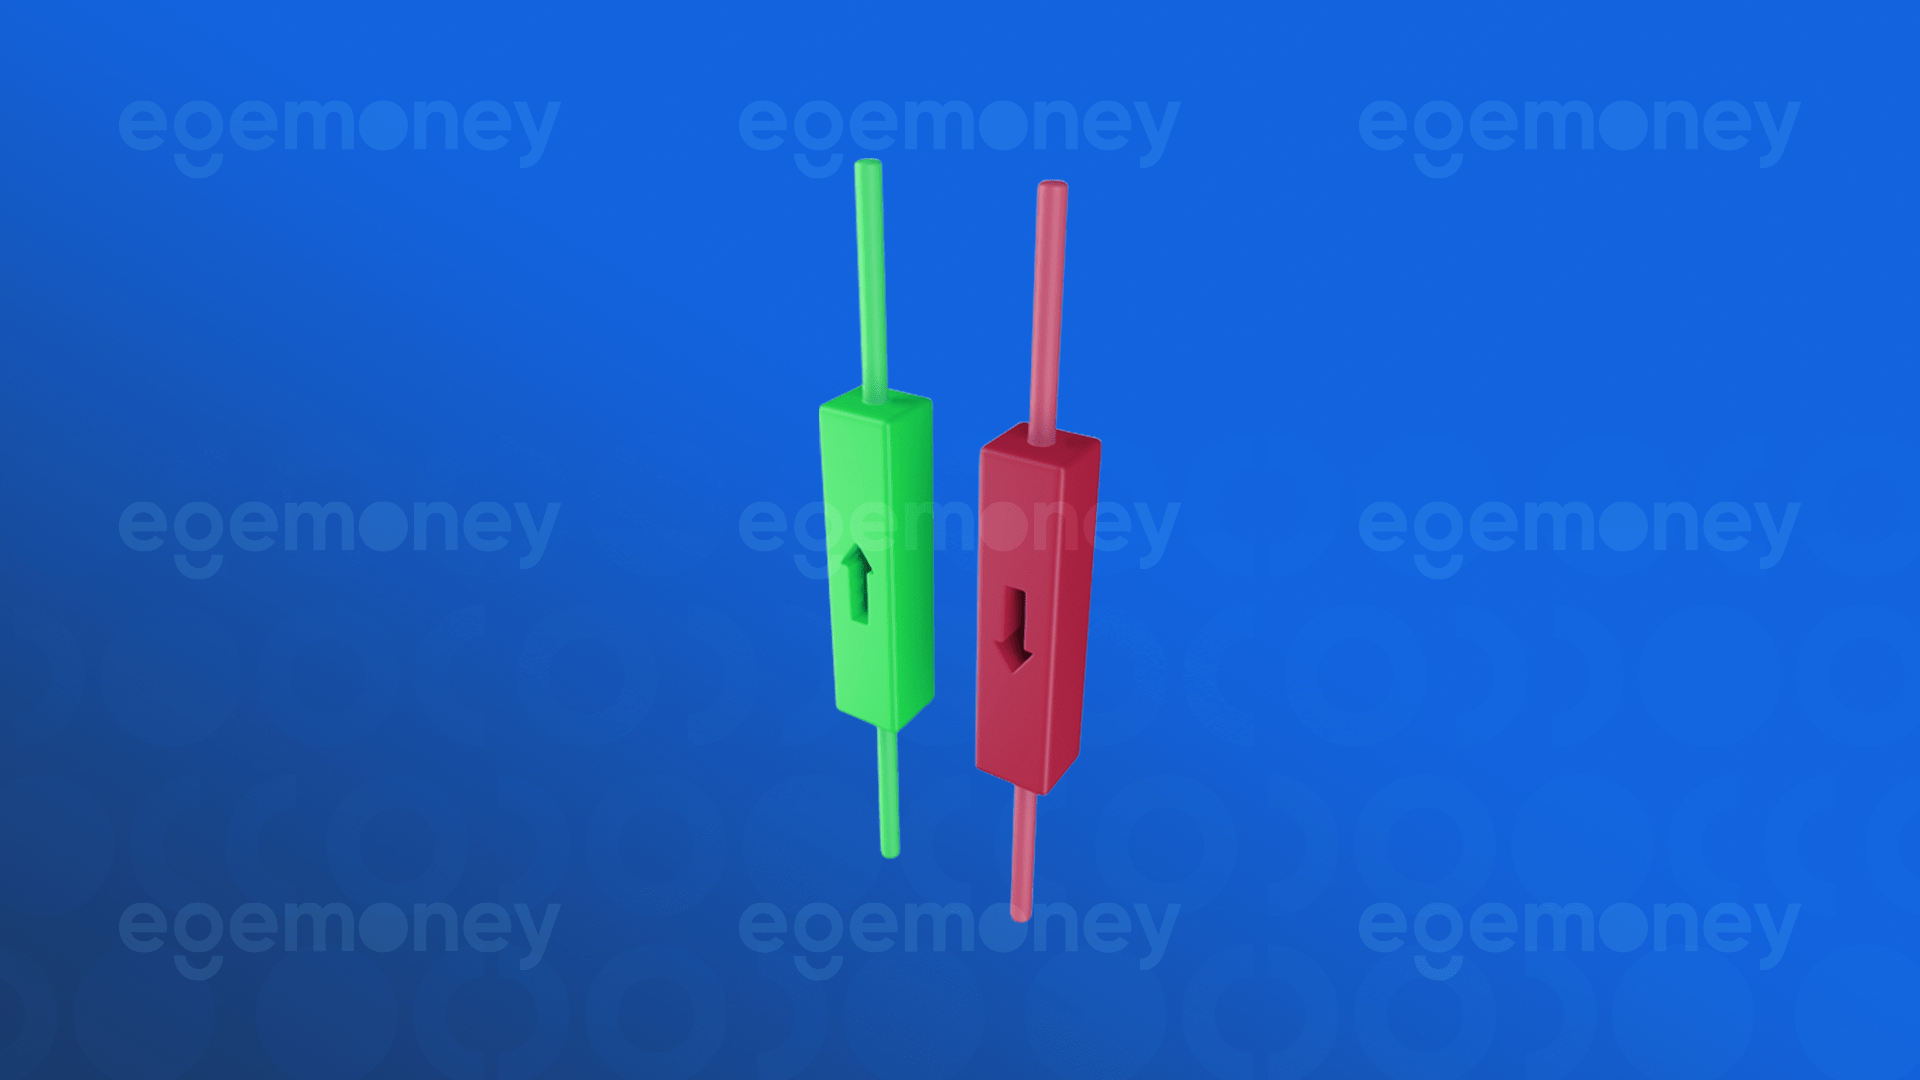
The body of the candlestick can be colored or hollow. If the closing price is higher than the opening price, the body is generally green, indicating an upward movement. This suggests stronger buying pressure and an increase in price. Conversely, if the closing price is lower than the opening price, the body is generally red, indicating a downward movement. This indicates stronger selling pressure and a decrease in price.
What Do Candlestick Patterns Tell Us?
Candlestick charts provide valuable information to traders about market sentiment, trend direction, and potential reversals. By analyzing the shape, color, and arrangement of candlestick charts, traders can gain insights into the psychology of market participants. Some important information conveyed by candlestick formations includes:
Candlestick charts reflect the collective emotions of market participants. Bullish candlesticks, typically green, indicate buying pressure and a positive sentiment that suggests potential upward price movement. Conversely, bearish candlesticks, typically red, indicate selling pressure and a negative sentiment that suggests potential downward price movement.
Some candlestick patterns can indicate potential trend reversals. For example, a formation known as a “hammer” or “shooting star,” characterized by a small body and a long lower wick, can signal a reversal from a downtrend to an uptrend or vice versa. Traders use these formations to identify potential entry or exit points in the market.
Candlestick charts can also indicate periods of price consolidation or indecision in the market. Doji formations, where the opening and closing prices are approximately the same, resulting in a small or nonexistent body, suggest a balance between buyers and sellers and the potential for a trend reversal or continuation, depending on the surrounding price action.
Types of Candlestick Formations
There are numerous candlestick formations, each with its own interpretation and significance. Here, we will examine some of the most popular and widely recognized formations in crypto trading:
Hammer and Hanging Man: Hammer and hanging man formations are characterized by a small body and a long lower wick. A hammer that appears after a downtrend signals a potential reversal to an uptrend, while a hanging man that appears after an uptrend indicates a potential bearish trend reversal.
Engulfing (Bullish/Bearish) Patterns: Engulfing patterns consist of two candlestick formations where the body of the second candle completely engulfs the body of the first candle. A bullish engulfing pattern occurs after a downtrend and indicates a potential reversal to an uptrend, while a bearish engulfing pattern forms after an uptrend and suggests a potential reversal to a downtrend.
Doji: Doji formations have nearly equal opening and closing prices, resulting in a small or nonexistent body. Doji candles indicate market indecision and, depending on the surrounding price action, can signal potential trend reversals or continuations.
Evening and Morning Stars: These special candlestick formations occur at the end of a downtrend (evening star) or an uptrend (morning star). They consist of three candles, with the middle candle having a small body and the other two candles having opposite colors. These formations indicate potential trend reversals.
Advanced Candlestick Chart Techniques and Trading Strategies
Advanced traders, who build upon the basic understanding of candlestick formations, often employ various techniques and strategies to enhance their trading decisions and avoid relying solely on one analysis method. Firstly, traders often validate the potential trend of any candlestick formation by verifying the high trading volume during the formation using volume analysis. For instance, if a bullish reversal pattern is forming with high trading volume, it indicates stronger buying pressure and increases the likelihood of a successful reversal.
Additionally, traders avoid relying on a single formation by looking for another pattern following a specific formation, which increases the probability of the expected scenario playing out. For example, a bullish engulfing pattern followed by a hammer formation can reinforce the bullish signal.
Finally, a widely adopted strategy involves analyzing formations that confirm trends. When an upward trend is accompanied by a bullish formation or a downward trend is followed by a bearish pattern, it confirms the continuation of the trend.
It’s worth noting that while candlestick patterns can provide valuable insights, they should be used in conjunction with other technical indicators and analysis methods for comprehensive trading decisions. In addition to candlestick chart techniques, tools such as Elliot Wave and ITB Analysis are commonly used by investors.