

Diverse analysis methods are employed to achieve successful investments in stock markets and financial markets. One of these methods is technical analysis. Technical analysis attempts to predict future price movements by examining past price actions and volume data. One of the key elements of this analysis is ‘divergences’. Divergence is a term that refers to discrepancies between prices and technical indicators. It is used to determine trend reversals in the market and has two main types: positive and negative divergence.
Divergences, especially, can be effective in identifying market turning points. The occurrence of divergences between price charts and technical indicators may indicate that the current trend is weakening and could soon reverse. This is important for investors to evaluate potential opportunities in the market. However, identifying and interpreting divergences correctly requires experience and attention. Therefore, it is important to perform a comprehensive analysis including other market data and indicators when using divergences.
Divergences can be detected with various technical indicators. Among the most commonly used indicators are the Relative Strength Index (RSI), MACD (Moving Average Convergence Divergence), and the Stochastic oscillator. These indicators assess the momentum of price movements and the strength of the trend. Correct identification of divergences requires understanding how these indicators interact with price movements.
To be successful in the stock market, investors need to adopt diversity in their market analyses. Although technical analysis is an important tool in supporting investment decisions, it should be evaluated in conjunction with other factors such as market conditions and fundamental analysis. Now, let’s examine more closely the two fundamental concepts of these analysis methods, positive and negative divergence.
How Do Positive and Negative Divergence Work?
Positive and negative divergence reflects the relationship between the price movements of a financial instrument and its technical indicators. Positive divergence occurs when the price is in a downtrend but technical indicators show an uptrend. This is considered a sign that prices might soon rise, as the indicators suggest the market is gaining strength. For example, if the price of an asset is falling while an indicator like the RSI (Relative Strength Index) is rising, this is positive divergence.
Negative divergence, on the other hand, represents the opposite scenario. Here, while prices are rising, technical indicators show a downtrend. This indicates that the market is weakening and prices might soon fall. For example, if the price of an asset is rising while an indicator such as the RSI is falling, this is negative divergence.
These divergences are used to anticipate changes in market trends. However, they should always be evaluated in conjunction with other technical analysis tools and market conditions, as they can be misleading and should not be considered reliable signals on their own.
What is Positive Divergence?
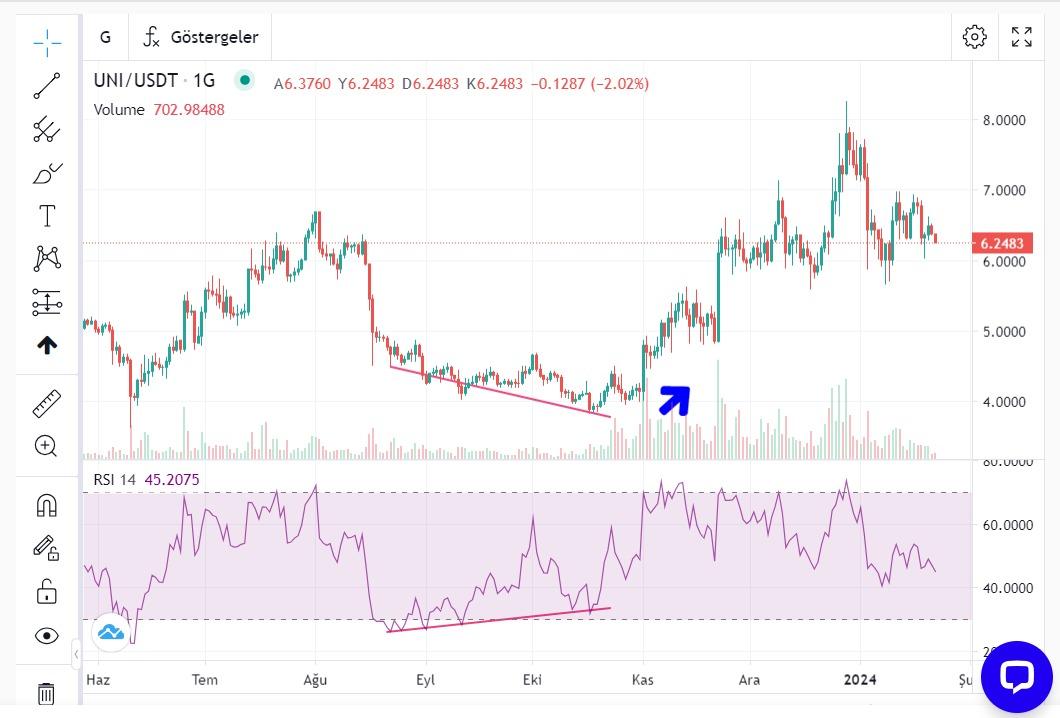
Positive divergence refers to a divergence that occurs between stock prices and technical indicators in the stock market. This situation arises when the price of an asset is in a downtrend, while technical indicators (such as RSI or MACD) give a rising signal. Positive divergence is particularly used to identify turning points in the market and generally signals buying opportunities for investors.
Positive Divergence and the Role of Technical Indicators
Positive Divergence and RSI (Relative Strength Index)
RSI is a popular momentum indicator used to measure the buying and selling pressure of an asset. It usually takes a value between 0 and 100. In the case of positive divergence, while the price of an asset falls, the RSI value rises. This indicates that selling pressure is decreasing and buying pressure is increasing. For example, if the price of a stock reaches new lows while the RSI starts moving up from 30 (oversold area), it can signal to investors a potential price increase in the near future.
Positive Divergence and MACD (Moving Average Convergence Divergence)
MACD is a trend-following indicator that measures the convergence and divergence of two moving averages. In the case of positive divergence, while the price of an asset falls, the MACD value may remain stable or start to rise. This can indicate that the current downtrend is losing strength and there might be a transition to an uptrend in the near future. MACD crossing above the zero line or the MACD line crossing the signal line upwards can be a strong indicator of positive divergence.
Positive Divergence and Moving Averages
Moving averages show the average price of an asset over a specific time period and are commonly used to determine the direction of the trend. In the case of positive divergence, while the price of an asset falls, short-term moving averages may show a horizontal movement or start to rise. This indicates that the current downtrend is weakening and an uptrend may begin. For example, if the price of a stock is falling while the 20-day moving average remains stable, this could give investors a clue about a possible trend change.
The Impact of Positive Divergence on Investment Decisions
Positive divergence can affect investors’ buying and selling decisions. This type of divergence generally indicates that the current downtrend is about to end and there could be a price increase in the near future. Therefore, it can be a critical indicator for investors planning to buy at lower prices. However, such signals may not always be accurate and can be misleading, so they should be used in conjunction with other market analysis methods.
Positive Divergence and Risk Management
Although positive divergence is an important tool in identifying potential buying opportunities in financial markets, it should also be carefully considered from a risk management perspective. Positive divergence signals can sometimes be misleading and lead investors to erroneous trades. Therefore, when positive divergence is detected, investors should avoid making decisions based solely on these signals and conduct a broad market analysis. Risk management techniques such as portfolio diversification, stop-loss orders, and determining appropriate position sizes are vital when using such signals.
What is Negative Divergence?
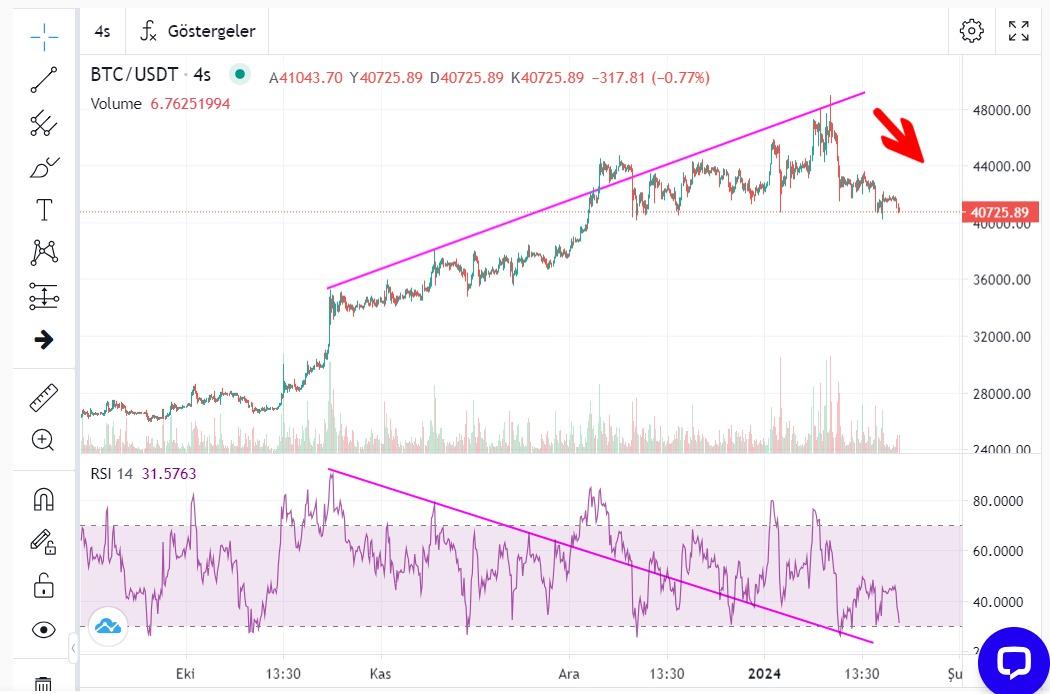
Negative divergence is a common concept in technical analysis, often indicating contradictory movements between an asset’s price and its technical indicators. This situation occurs when an asset’s price is increasing, while technical indicators show a downward trend. Negative divergence is particularly observed when the market is in an overbought condition and can signal an impending correction or price decrease.
Like positive divergences, negative divergences are typically identified using momentum indicators such as the Relative Strength Index (RSI), MACD (Moving Average Convergence Divergence), and the Stochastic oscillator. For instance, if a stock’s price is reaching new highs but the RSI indicator shows a downward trend, it is considered a negative divergence. This indicates that the market has reached overbought conditions and a price decrease may occur soon.
Negative divergences can be interpreted as potential sell signals for investors. However, it’s important to remember that these signals might not always be accurate and can be misleading. Therefore, when negative divergence is detected, investors should conduct additional market analyses and apply a comprehensive risk management strategy. Investment decisions should consider not only technical indicators but also market trends, economic news, and other relevant factors.
Negative Divergences and the Role of Technical Indicators
Negative Divergence and Relative Strength Index (RSI)
RSI is a popular indicator that measures market momentum and typically ranges between 0 and 100. In a negative divergence situation, as an asset’s price increases, the RSI value begins to fall. This indicates a decrease in buying pressure and an increase in selling pressure. For example, if a stock’s price is reaching new highs while the RSI starts moving down from 70 (overbought area), it can signal to investors a potential price decrease in the near future.
Negative Divergence and MACD (Moving Average Convergence Divergence)
MACD is a trend-following indicator based on the convergence and divergence of two moving averages. In negative divergence, as an asset’s price increases, the MACD value may fall or remain constant. This indicates that the current uptrend is losing strength and may shift to a downtrend soon. MACD falling below the zero line or the MACD line crossing the signal line downwards can be a strong indicator of negative divergence.
Negative Divergence and Moving Averages
Moving averages show the average price of an asset over a specific time frame and are commonly used to determine trend direction. In negative divergence, as an asset’s price increases, short-term moving averages may start to decline or show a horizontal trend. This indicates a weakening of the uptrend and the possibility of an emerging downtrend. For instance, if a stock’s price is rising while the 20-day moving average starts to decline or remains stable, it can provide investors with a significant clue about a possible trend change.
The Impact of Negative Divergence on Investment Decisions
Negative divergence can have a significant impact on investors’ buying and selling decisions. This type of divergence generally suggests that the current uptrend may be ending and a price decrease could occur soon. Therefore, it can be a critical indicator for investors planning to sell at higher prices. However, as these signals may not always be reliable and can be misleading, they should be evaluated in conjunction with other market analysis methods.
Negative Divergence and Risk Management
While negative divergence is an important tool in identifying potential selling opportunities in financial markets, it should also be carefully considered from a risk management perspective. Negative divergence signals can sometimes be misleading and lead investors to erroneous trades. Therefore, when negative divergence is detected, investors should avoid making decisions based solely on these signals and should conduct a comprehensive market analysis. Risk management techniques such as portfolio diversification, stop-loss orders, and determining appropriate position sizes are crucial when using such signals.
The information presented in this article is for general informational purposes and does not constitute any investment advice. Readers are advised to conduct their own research and consult a professional financial advisor before making financial decisions.